SIT743: Bayesian Learning And Graphical Models Assignment 1 Help
Question
SIT743: This assignment for Deakin University Australia assesses the engineering students’ ability to demonstrate their learnings related to Bayesian Learning And Graphical Models. The assessment demands the student to apply their learnings related to the data science and machine learning and answer all the questions given in the assessment file accurately. The student will be required to use and depict mathematical formulas to approach these Probabilistic Graphical Models based questions.
Solution
The solution for this essay comprises of a written document which includes answers to all the statistical questions in a clear an concise manner. The assignment included five questions, which further are divided into various sub-questions. Our experts have answered all the answers to these respective questions using their expertise in the statistical knowledge related to machine learning.
Question 1
In the first question, the student is required to assess the dataset of “DataMyrmindon2023.csv” provided in the assessment file, which provides information about different air and seawater variables. The student is required to generate 30,000 data using a specific matrix and answer the sub-questions based on this generated data.
Question 1.1
In this sub-question, a box plot and a histogram are created for the humidity variable. Additionally, a brief overview of the humidity levels is also provided by our experts.
The sample contains 30,000 records for five variables (AirTemperature, Pressure, Humidity, WaterTemperature, WindSpeed). These variables are all continuous. The relative humidity ranges from 30.5% to 99.9%, with a mean of 74.71% and a median of 75.1%. The first quartile (25 percentile) of the humidity is of 69.3%, and the third quartile (75 percentile) of 81%.

Want to read more? Reach out to us over mail- onlineassignmentservices1@gmail.com.
Question 1.2
In this question, a summary of statistics has been chosen for the humidity variable as a centered value for the same. You can read a snippet of what our experts have written for this answer below:
The appropriate summary statistics to be used should be ‘Median’ for central tendency and ‘Interquartile Range’ for the spread. This is because, the distribution is skewed.
Looking for Bayesian Learning And Graphical Models Assignment 1 Help? Call us at +61 871501720.
Question 1.3
Next, a parallel box plot needs to be created for the other two variables of Air Temperature and Water temperature. This is further compared and contrasted by our experts to analyze their results.
Parallel box plot for variables “AirTemperature” and ‘WaterTemperature’:

For the Water temperature (in degree Celsius), the lower quartile, first , median, third and upper quartile are, respectively, 23.38, 25.30, 27.29, 28.10, and 30.01. For the Air temperature in degree Celsius, the corresponding quartiles are 14.8, 23.9, 26.3, 27.8, and 30.1. According to the parallel box plot for air and water temperature, we can compare their center of the data, their spread of the data, and their skew of the data set:
- Comparison of centers: The median Water temperature is greater than that of the Air Temperature.
- Comparison of spread : The interquartile (as shown by the lengths of the boxes) range is lower for water temperature than for air temperature.
Still confused about how our experts calculated these statistical derivations? We will be able to better assist you over WhatsApp- +447956859420.
Question 1.4
In this answer, a scatterplot has been created for the variables of Pressure and Air Temperature. Based on this scatterplot, our experts have calculated the correlation coefficient and the coefficient of Determination.
Scatterplot of ‘Pressure’ (as x) and ‘AirTemperature‘ (as y), plus the least-squares regression line in blue color that best fits the data:
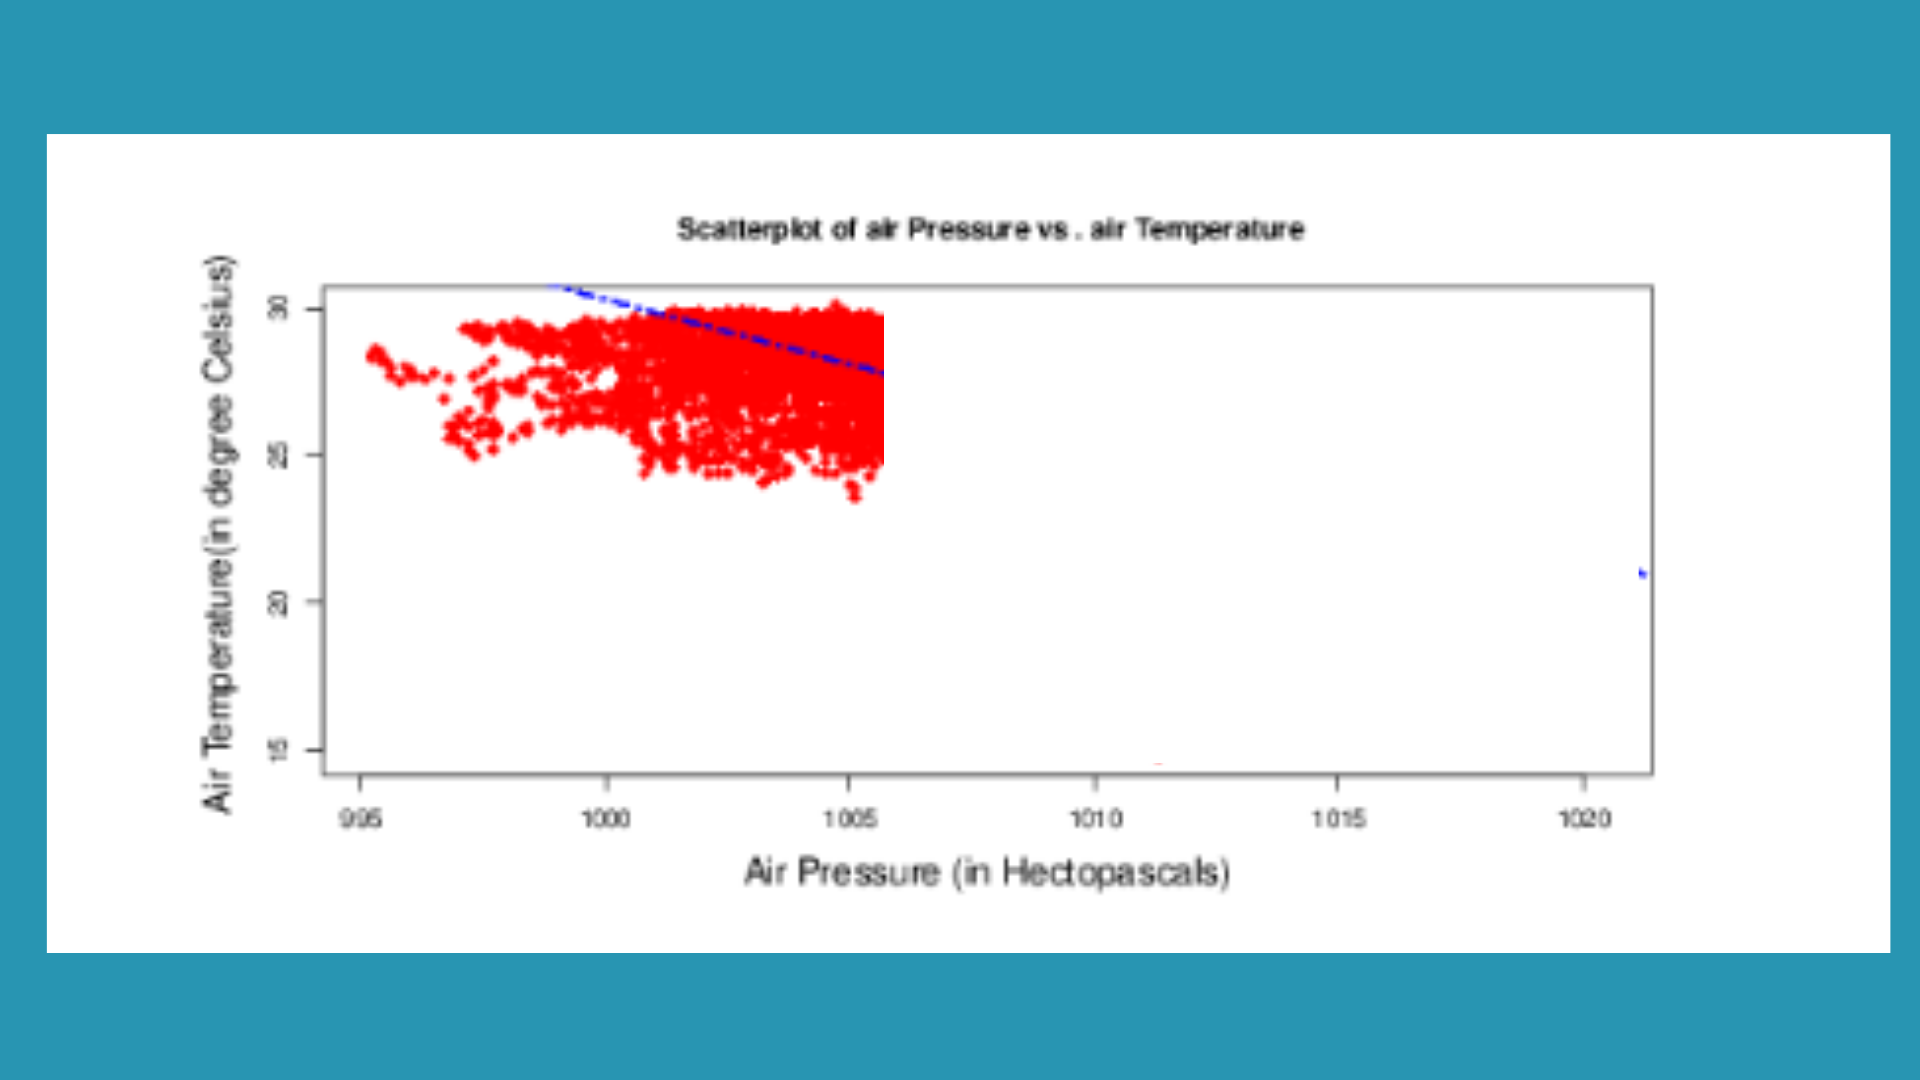
The least-squares regression line is: y = 468.843 – 0.439 * x I.e AirTemerature = 468.843 – 0.439 * (Pressure) The correlation coefficient is of -0.7309888 The coefficient of Determination is equal to 53.43% ( Multiple R-squared).
Were you looking for Bayesian learning and graphical models assignment 1 help answers? We are here to help! Reach out to us at onlineassignmentservices1@gmail.com.
Question 1.5
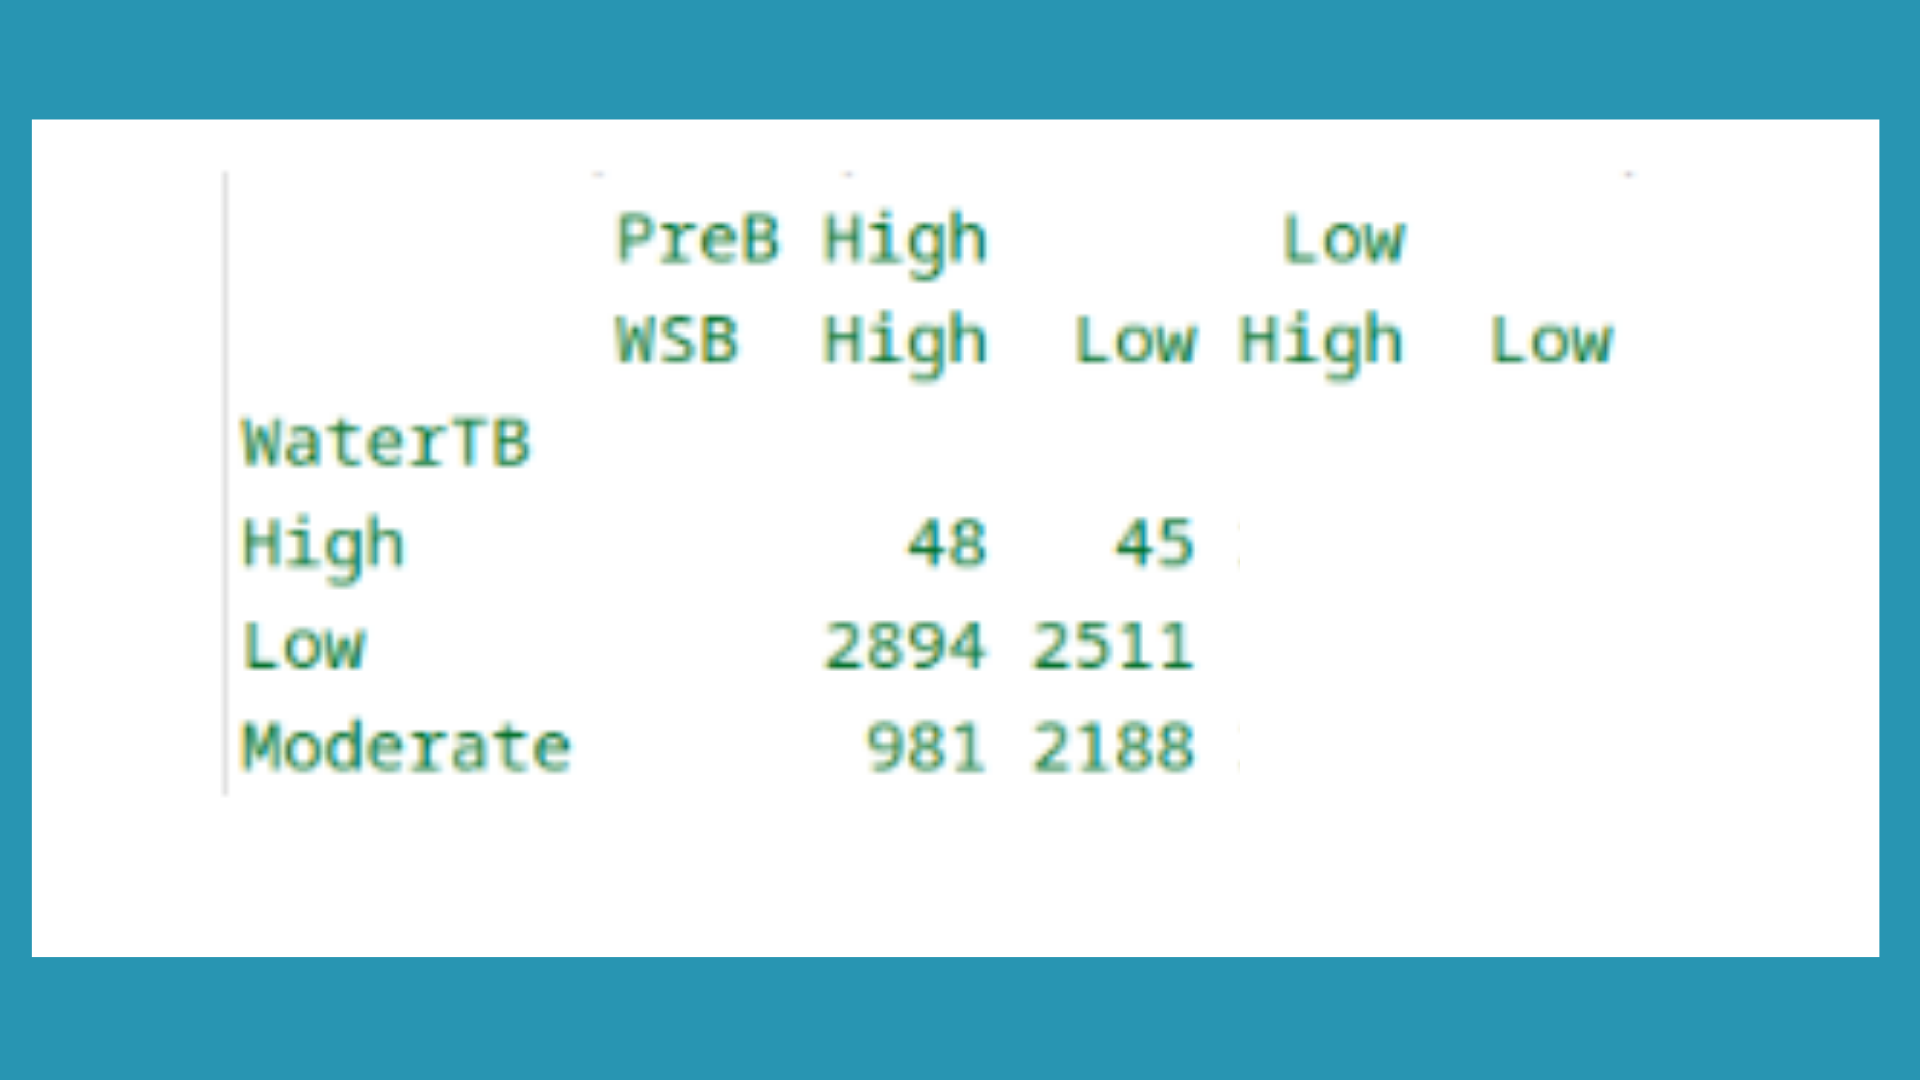
This section requires the student to develop three new variables including Water TB, PreB, and WSB. Based on these, an R table has been constructed. Our experts have also answered questions related to the probability of the three variables based on this analysis.
Question 1.5 (a)
Question 1.5 (b)
- The probability that the WSB is Low is 20086/30000= 0.66953
- The probability that the WaterTB is moderate given that the WSB is high = number of WaterTB is moderate and WSB is high / total number of WSB is high = 4004 /9914 = 0.4038733
iii. The probability that the WaterTB is low given that the WSB is high and the PreB is low = number of WaterTB is low and WSB is high and the PreB is low / total WSB is high and the PreB is low = 512 / 5991 = 0.08546153
This is only 50% of the solution. To know more, WhatsApp us at +447956859420.

Question 2.1
Question 2.1 (a)
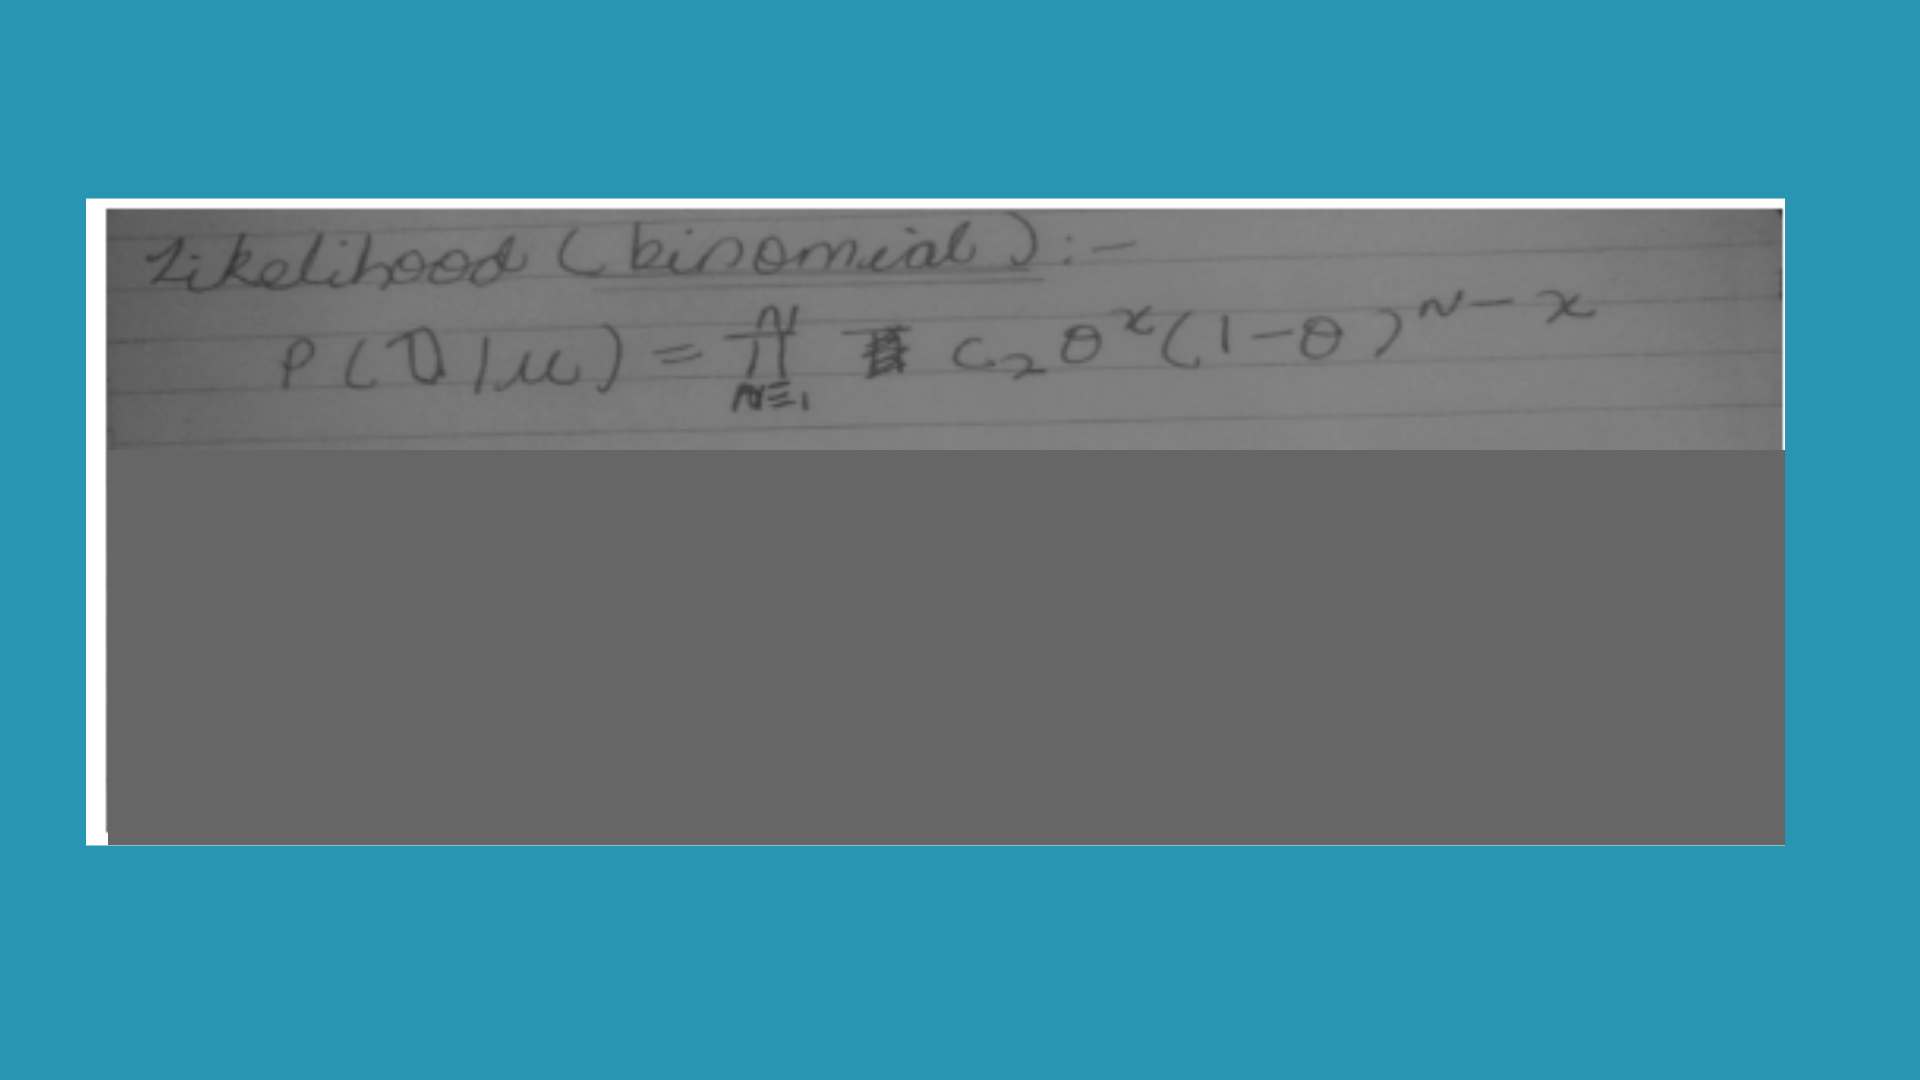
In this section, our experts have identified two distinctions between the Bayesian approach and the frequentist approach to parameter estimation by employing mathematical formulas.
Bayesian and frequentist statisticians have different philosophies when it comes to probability and statistics. In frequentist statistics, probability is defined as the long-run relative frequency of an event in an infinite number of trials. This approach is based on the idea that the true value of a population parameter is fixed, but is unknown and must be estimated from data. Statistical inferences are made based on the observed data alone by making assumptions about the underlying data-generating process and using techniques such as point estimation, confidence intervals, and hypothesis testing. This means that frequentists are focused on the probability of observing a particular outcome given a specific set of parameters or hypotheses. On the other hand, Bayesian statisticians see probability as a measure of our degree of belief or uncertainty in a statement or hypothesis. This approach allows for the 7 incorporation of prior knowledge and evidence into statistical analysis through the use of Bayes’ theorem. Bayesian statistics is based on the idea that probability can be updated as more data is collected, and statistical inferences are made based on both the observed data and our prior beliefs. This results in a full distribution over the parameter space, known as a posterior distribution, which can be used to make probabilistic predictions and to quantify uncertainty.
Were you searching for Bayesian Learning And Graphical Models Assignment 1 Help? Give us a call at +61 871501720.
Question 2.1 (b)
In this answer, the variance or error in an estimate is calculated using the frequentist method by our experts. You can read half of the complete answers written by our experts.
The frequentist approach uses the confidence interval to compute the uncertainty (or variance/error) in an (parameter) estimate.
Question 2.1 (c)
Based on the analysis of the purpose of conjugate priors in Bayesian statistics, our experts have illustrated a conjugate pair.
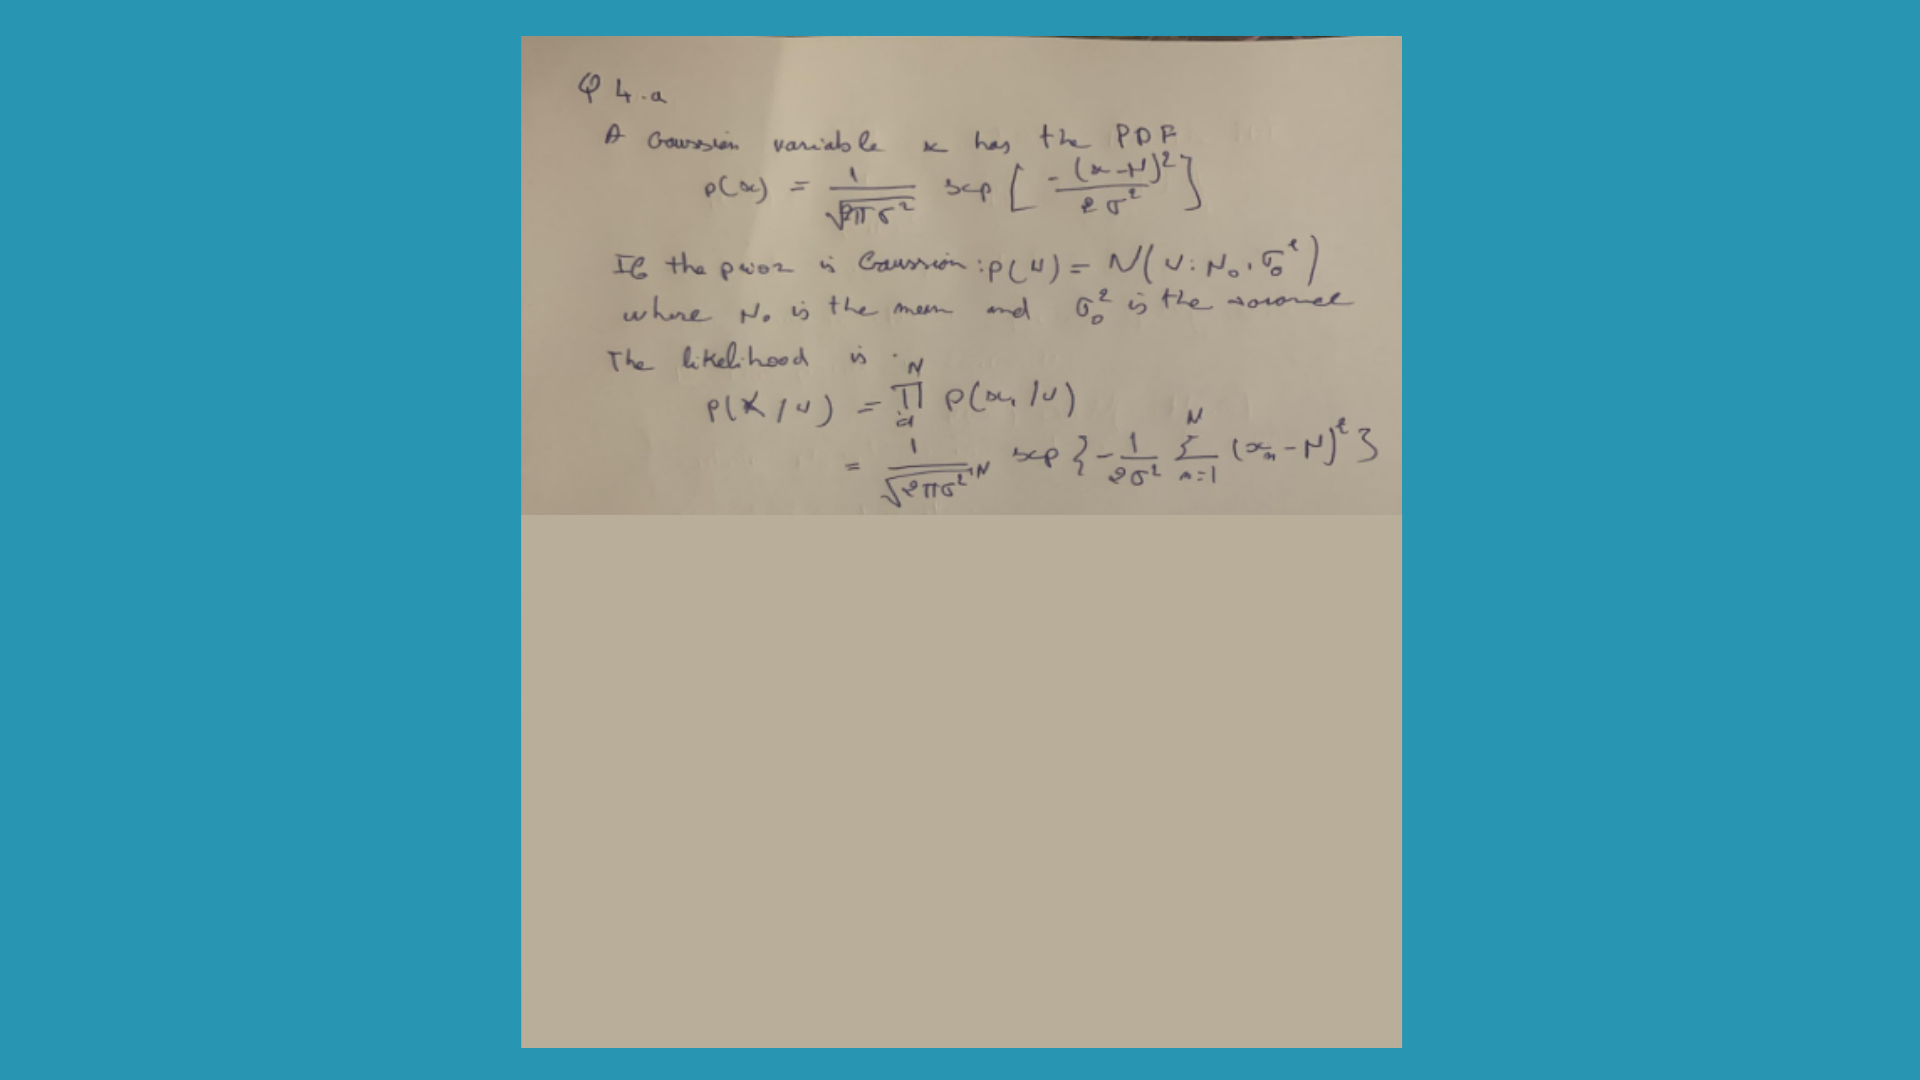
If the posterior distributions p(θ|x) is in the same family as the prior probability distribution p(θ), the prior and posterior are then called conjugate distributions, and the prior is called a conjugate prior for the likelihood function. If there is a Gaussian family which is conjugate to itself with likelihood function to be Gaussian as well, the posterior distribution will also be a 8 Gaussian. Thus, we say that the Gaussian distribution is a conjugate prior for the likelihood that is also Gaussian.
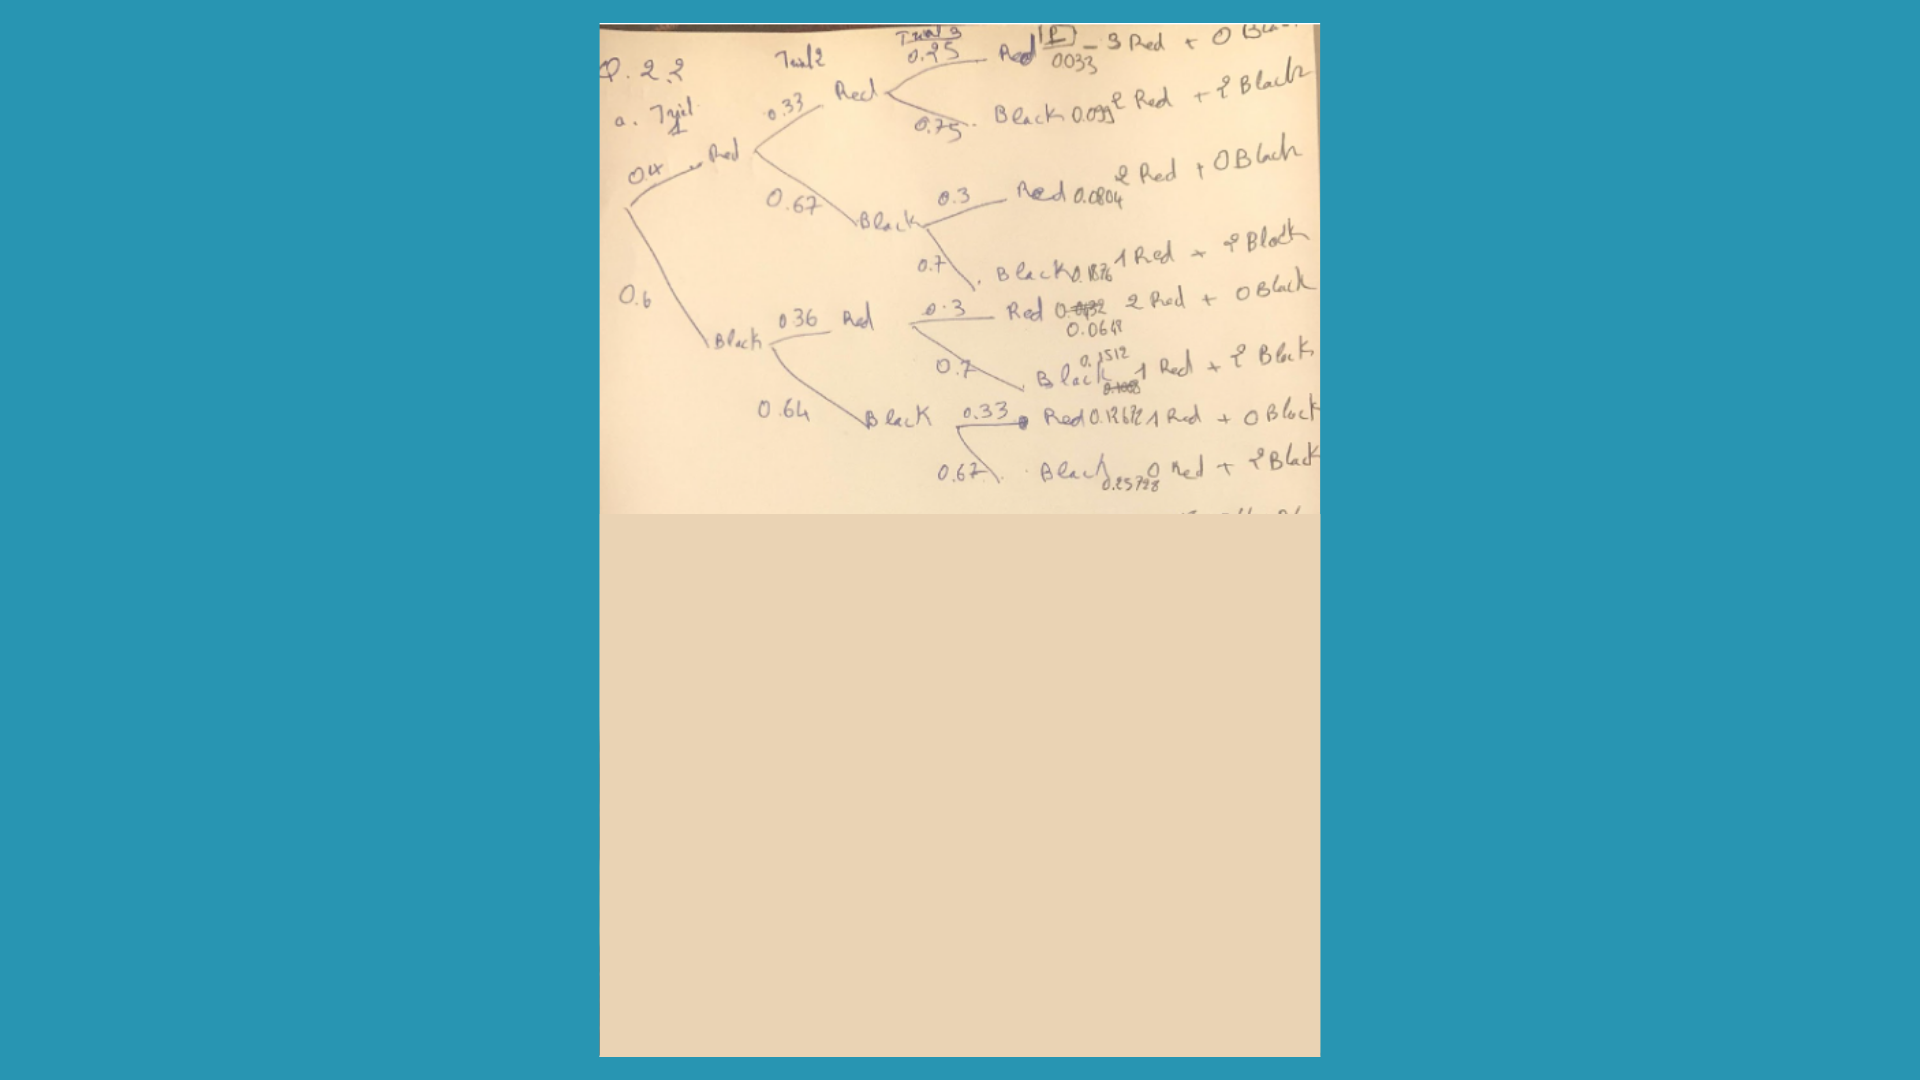
Question 2.2
This question demands the student to evaluate the probability case scenario provided in the assessment file and answer the questions that follow. It is remarked that six black and four red marbles are in a basket. John has made three consecutive picks from the basket. He does not place the red stone back in the basket if he chooses to keep it with him throughout each pick. After three selections, the student needs to create a tree diagram, the probability of choosing two black marbles, the probability of only one marble being red, the probability of at least one marble being red, and the probability of the second marble being black if it is known that the third one was black as well.
Interested in reading more about Probabilistic Graphical Models? Wait no more, and call us at +61 871501720 today.
Question 3 Frequentist and Bayesian estimations
This question is based on the statistical analysis of the case of a large manufacturing company named 3DComp. As the company aims to simulate the 3D printers’ lifespan, it has been revealed through the research, that a 3D printer’s lifetime, 𝒙𝒊, has an exponential distribution with an unknown parameter.
For this assessment, the student is required to evaluate the average lifespan of a particular 3D printer.
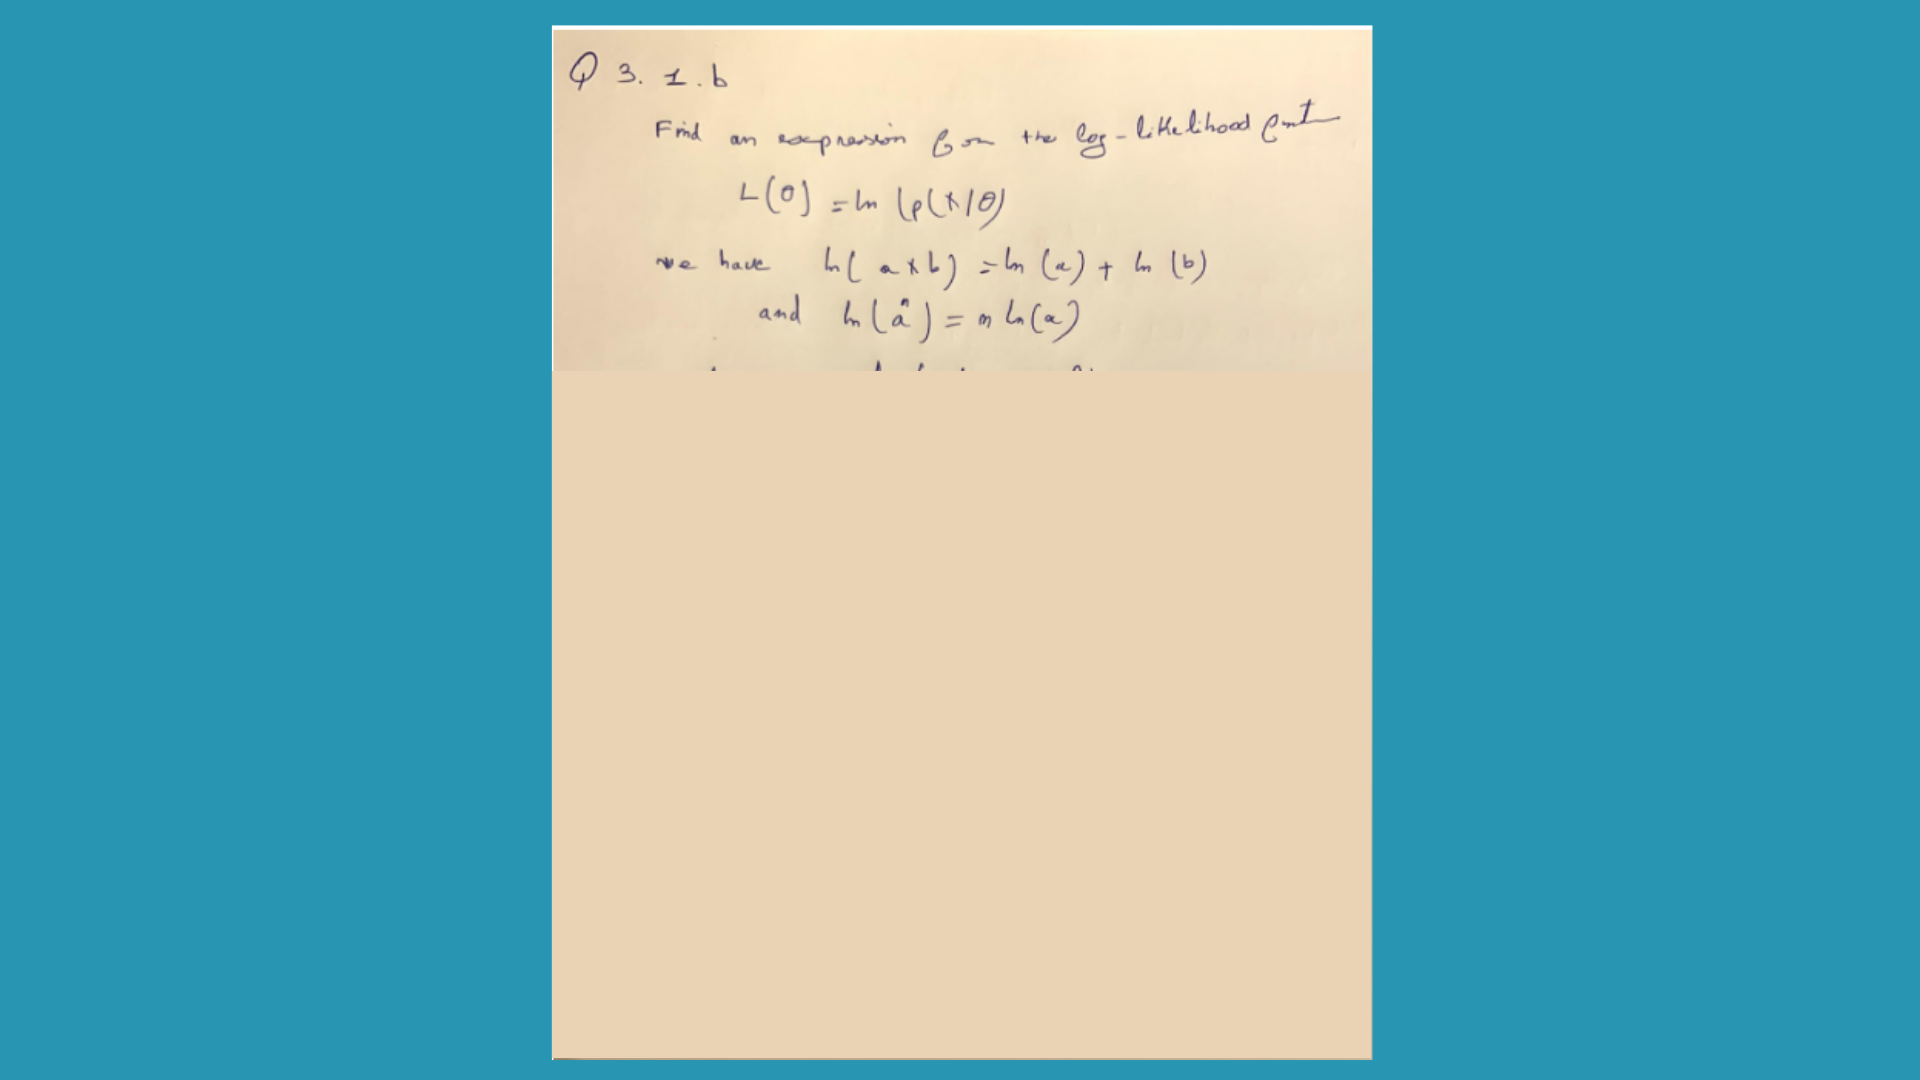
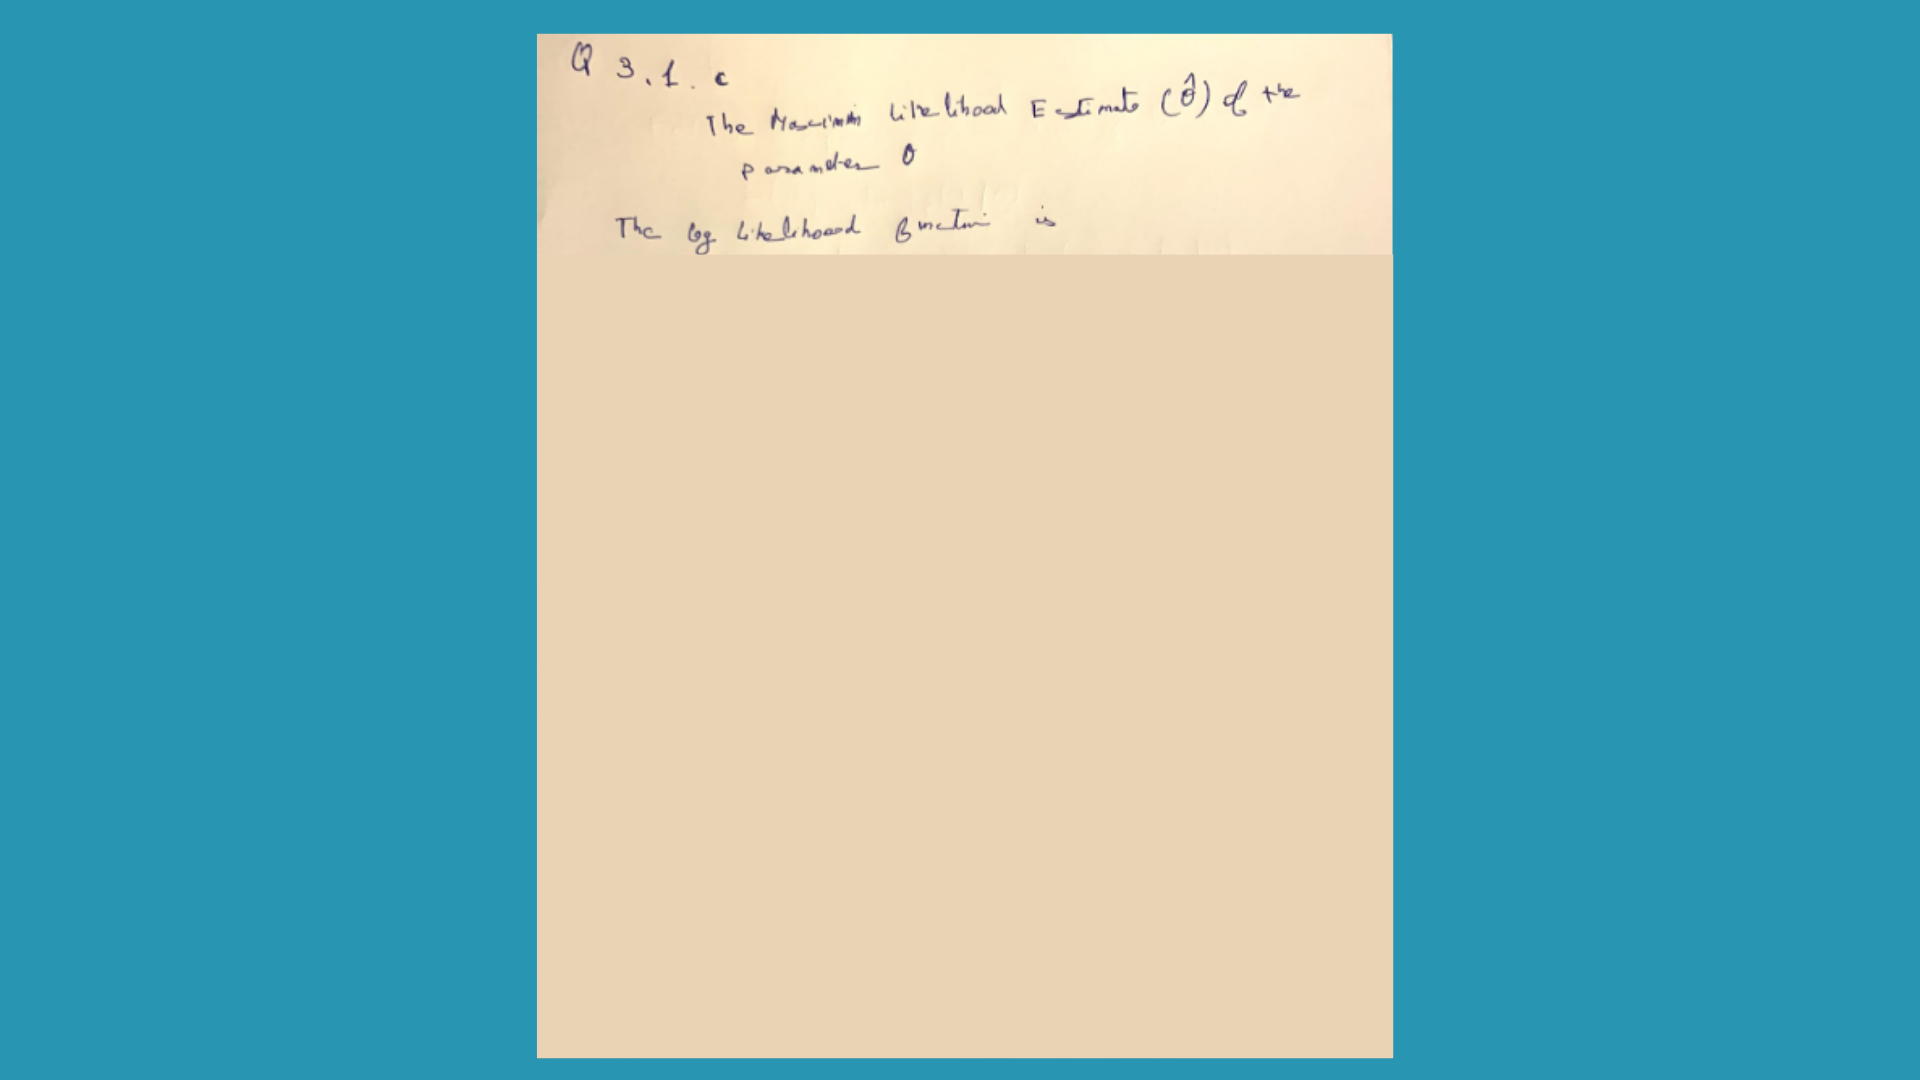
Question 3.1
In this sub-section, an analysis needs to be done foregrounded in the frequentist approach.
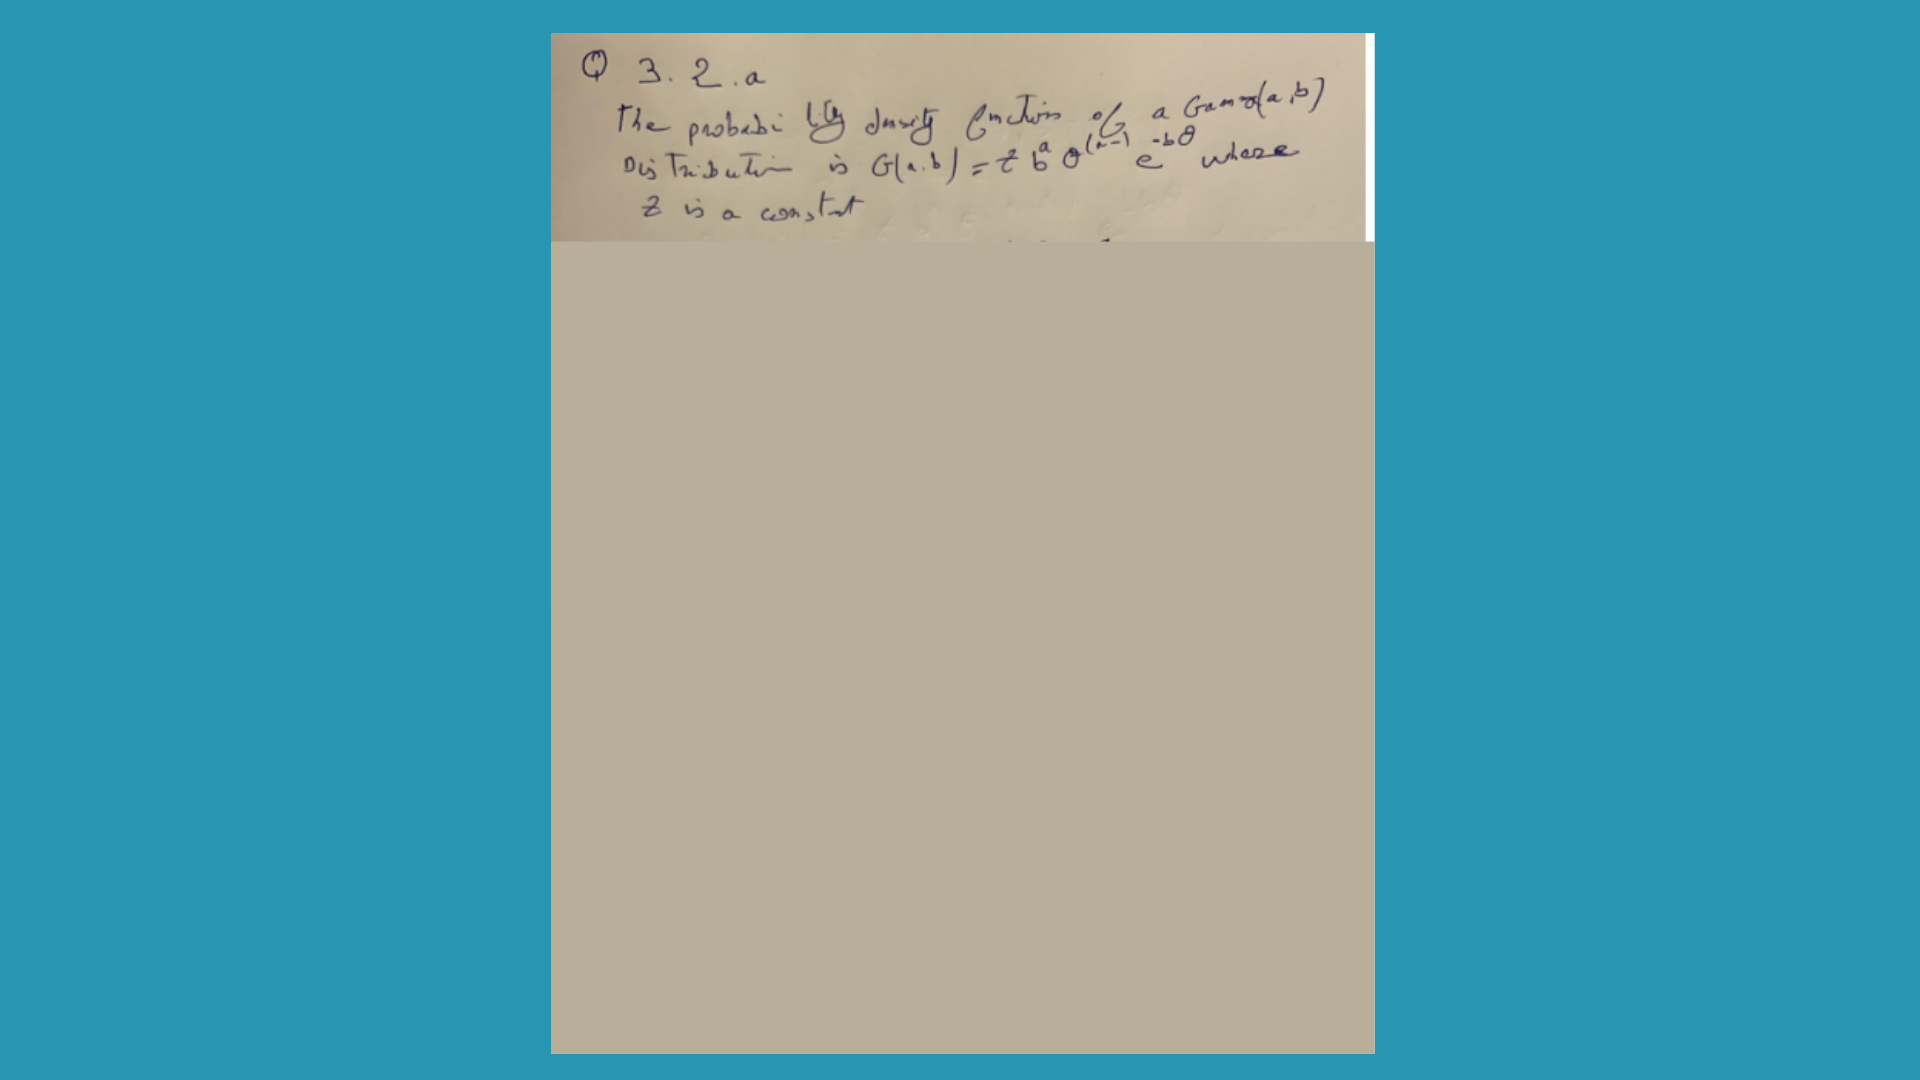
Question 3.2
Next, it has been remarked that the business spoke with a manufacturer of 3D printers. It has been determined through conversations with the company’s engineers that the parameter pattern is governed by a Gamma distribution. This section presents the calculations done by our experts based on this analysis.

Did you like the answer written by our experts? Let us help you as well. Reach out today- onlineassignmentservices1@gmail.com.
Question 4 Bayesian inference for Gaussians
The questions for the fourth section are based on a manufacturing business that produces temperature sensors and conducts quality tests. Experiments conducted on a haphazard selection of 𝑛𝑛 sensors reveal an average temperature inaccuracy to be one and a half degrees Celsius. The student is supposed to answer the questions based on the application of statistical analysis calculations for this particular company. We have provided a brief snippet of the complete solutions done by our experts.

Need Bayesian learning and graphical models assignment 1 help answers? Just WhatsApp us at +447956859420.
Question 5 Clustering
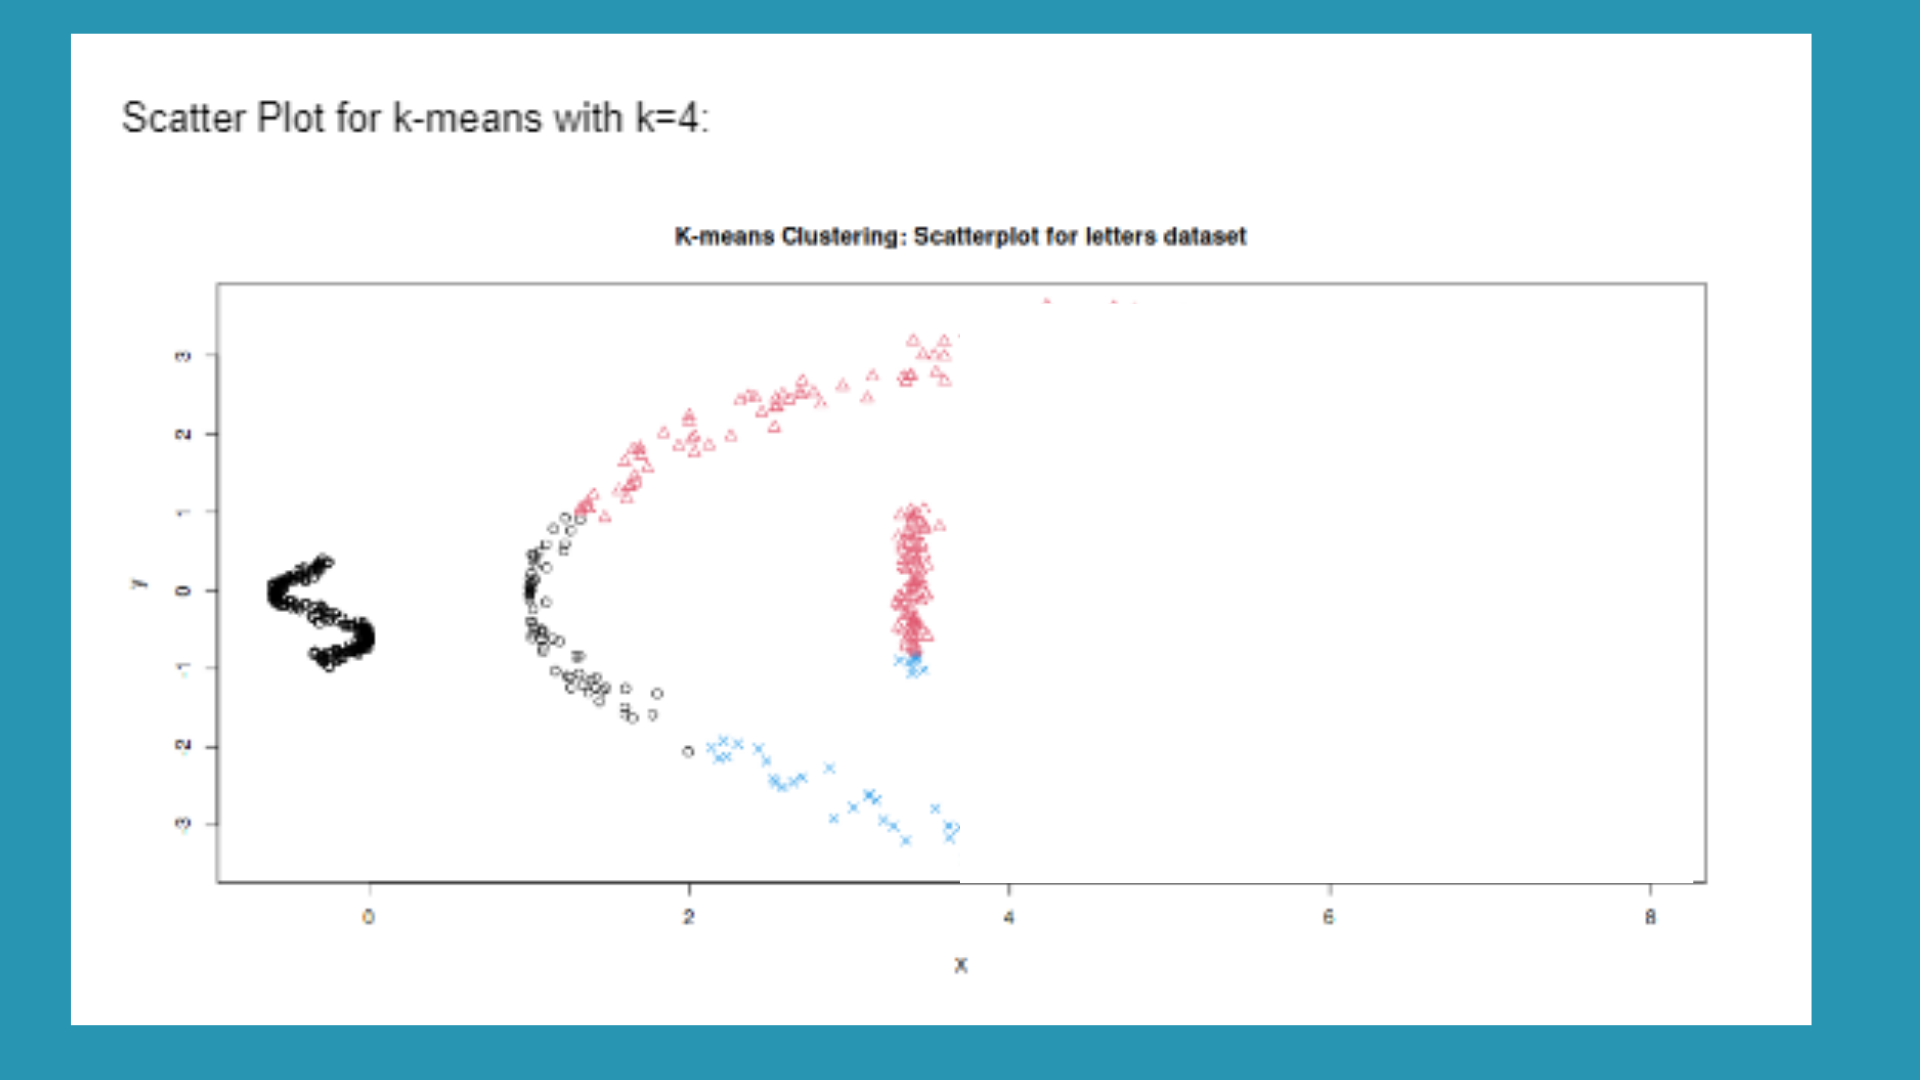
Q5.1 K-Means clustering
Our experts have presented the answers to this question through an analysis of the data file “lettersdata.txt”.
According to the below scatter-plot, we see that there are 4 clusters in the data.
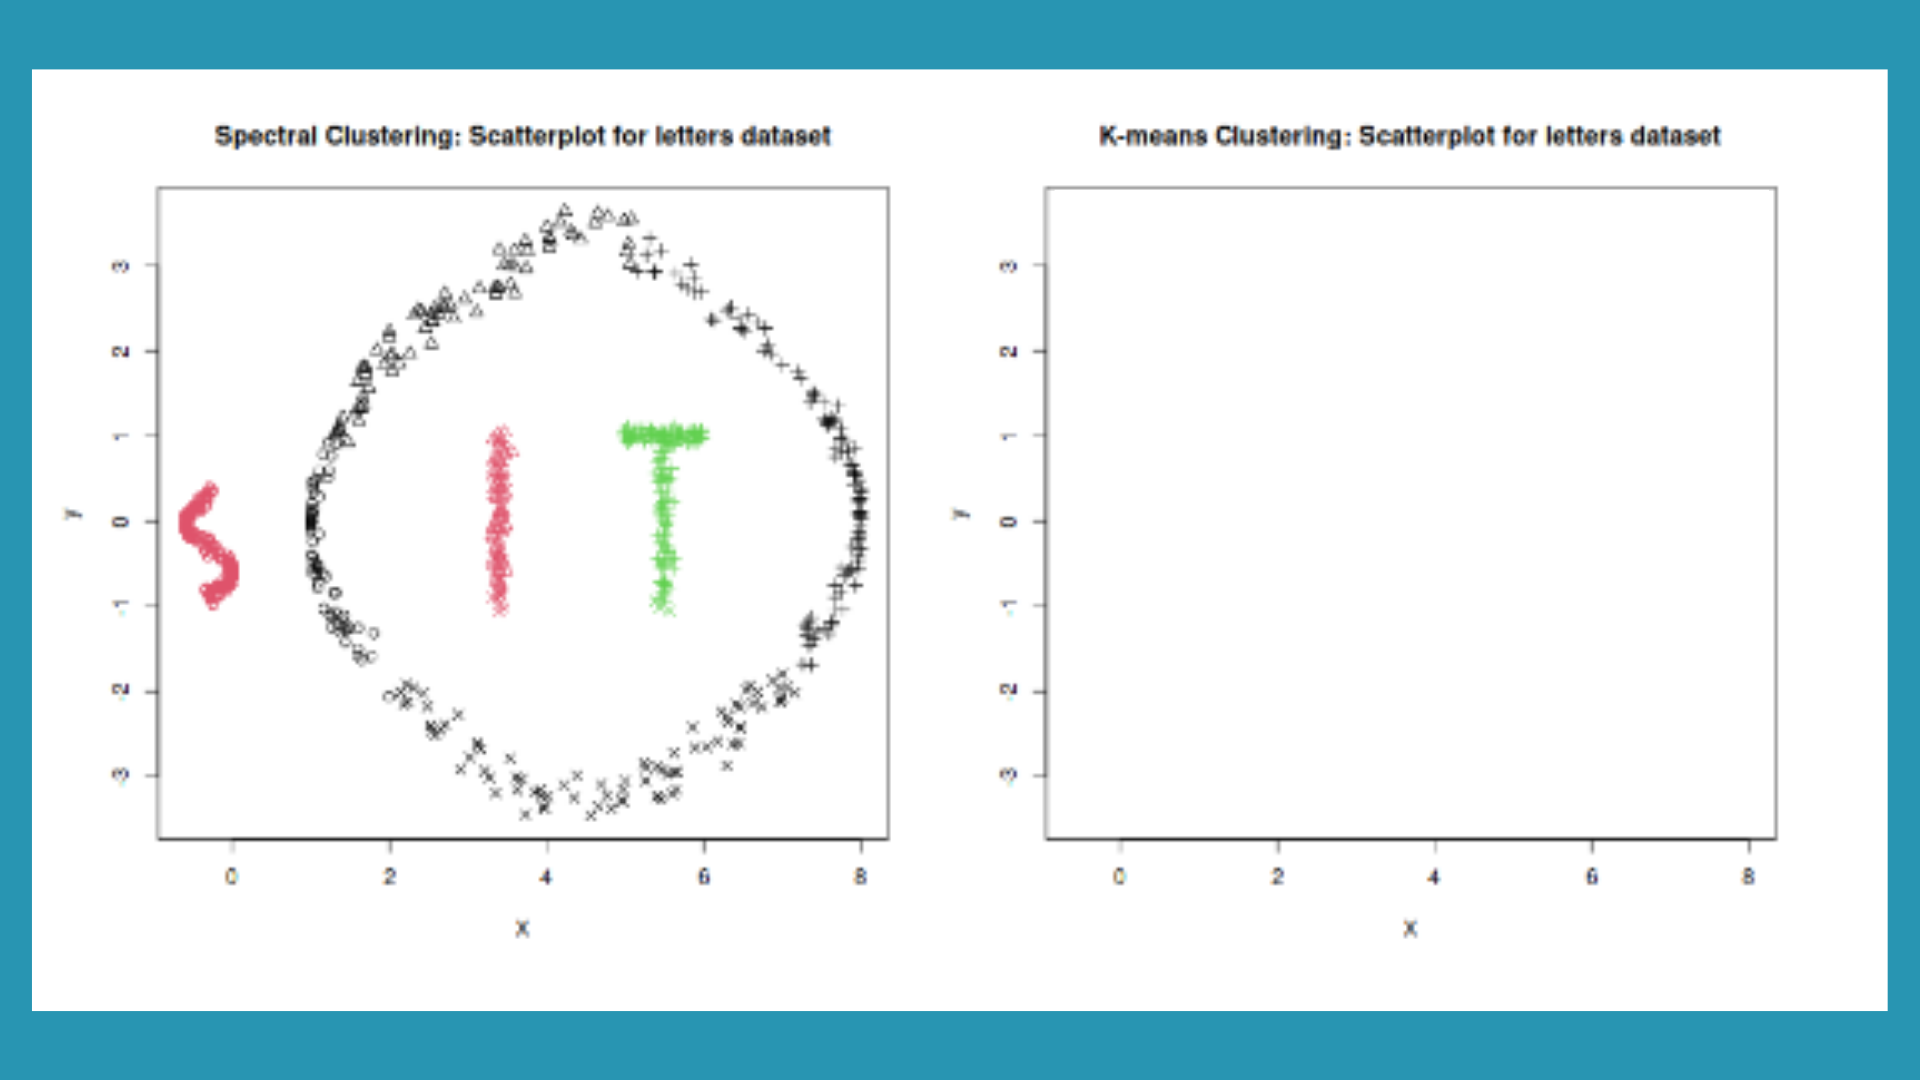
Q5.2 Spectral Clustering
For the same dataset used above “lettersdata.txt”, this section presents spectral clustering calculations for the data. Our experts have depicted this data using a scatter plot chart, a part of which you can see below:
We perform the k-means clustering on data with number of classes, k=4.
Looking for Bayesian Learning And Graphical Models Assignment 1 Help? you are at the right place! Give us a call today- +61 871501720.
