PHE5EPB: Biostatistics Assignment Help

Question
PHE5EPB: This biostatistics assignment requires the students to thoroughly read and review the research studies provided in the assignment file, and carefully undertake the statistics-related calculations. Using the data provided to the students, a comprehensive analysis needs to be done to appropriately attempt all the required questions. There are three sections in the assignment and the first section is divided into further six sub-questions.
Solution
Study 1
The first section of the assignment is a study related to the impact of smoking among mothers during their first trimester of pregnancy on the child’s birth weight. The data collected was from the hospitals and incorporated two different variables. Keep reading to know more about the calculations done by our experts for the different questions asked related to the first study.
The first section of this study requires the students to construct a table for demographic factors by the low-birth-weight variable. Our experts have used the Pearson Chi-square for independence test for the analysis.
- Create a table of 4-5 demographic factors by the variable, LBW (low birth weight).
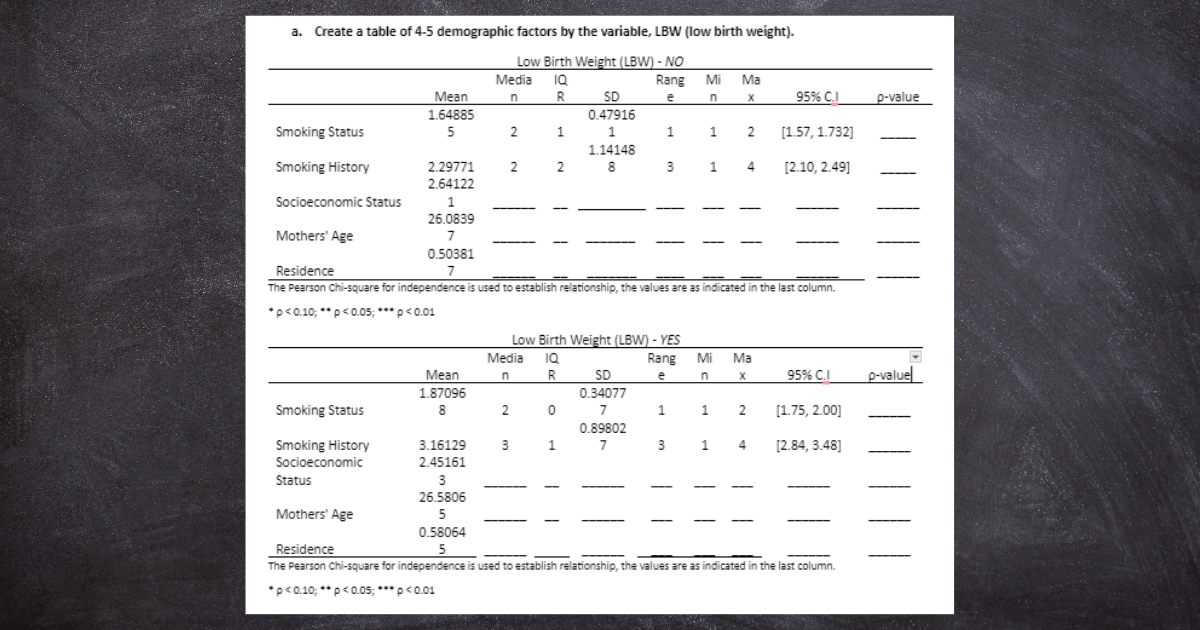
A quick look at the table above shows that the two groups of LBW (NO Low birth weight and low birth weight) have almost the same weight spread (slight weight difference) with the specific difference observed for Mothers’ age.
We have provided the statistical analysis of only two of the factors. If you wish to read the complete table, please call us at +61 871501720.
The second part requires the student to propose the null and alternative hypothesis for the correlation between the smoking of mothers and its impact on the birth weight of the child. Additionally, the test best suited for testing the hypothesis should be proposed and conducted. The assignment also urges the student to think about the assumptions in the test concluding with a brief for the findings of the test conducted by the student.
2. The relationship between the birth weight and mothers’ smoking status.
- Null Hypothesis: The proportion of people who have low birth weight is equal among those who never smoked and ever smoked. Null hypothesis: p = 0
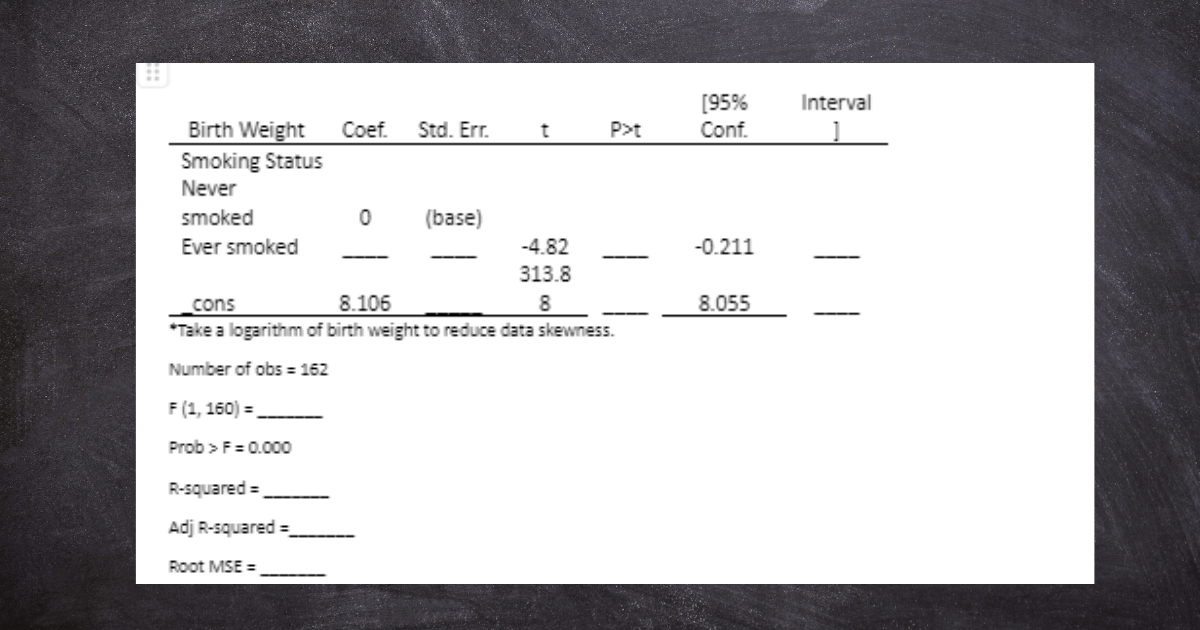
iv. Regression Analysis Assumption
- Linear relationship
- Multivariate normality
- _______________
- _______________
- _______________
These are only 50% of the calculations done by our experts. Want complete calculations? Wait no more and WhatsApp us at +447700174710.
In the next part, the correlation between the weight of babies is assessed with the history of smoking for the mothers. The solution incorporates the summary of the statistical calculations done for the weight of babies by the four categories of the smoking history of mothers. Here a statistical test needs to be done and the assumptions related to it are to be highlighted.
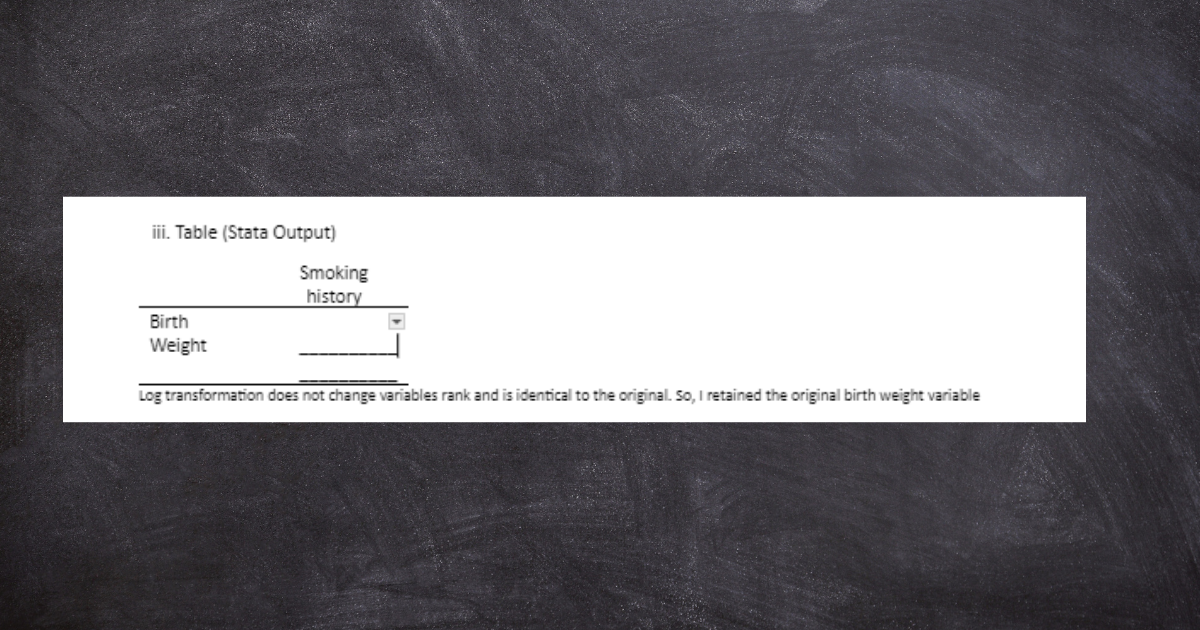
3. The relationship between the birth weight of babies and their mothers’ smoking history.
Birth weight by the four categories, shows that more mothers smoked never smoked (n = 47) with a median value of 1 and about 32 of them, quit before pregnancy.
Correlation (Spearman’s Rank-Order Correlation)
Why? Smoking history is measured on an ordinal scale and birth weight measured on an interval scale.
Assumptions of Spearman’s Rank-Order Correlation
- One variable should be measured on an ordinal scale (smoking history) and the other interval (birth weight, kg)
- Both variables (X and Y) need to be approximately not normally distributed (non-parametric).
- __________________________________________________________________________
- __________________________________________________________________________
- __________________________________________________________________________
Stuck with your statistical calculations? Let us help you. Reach out today- onlineassignmentservices1@gmail.com.

Following this, a test needs to be proposed to assess the confounding effect of the SES variable. The solutions also incorporate conducting the test and proposing whether SES comes out to be a confounding variable.
d. SES as a potential confounder in the relationship.
Multiple Linear Regression
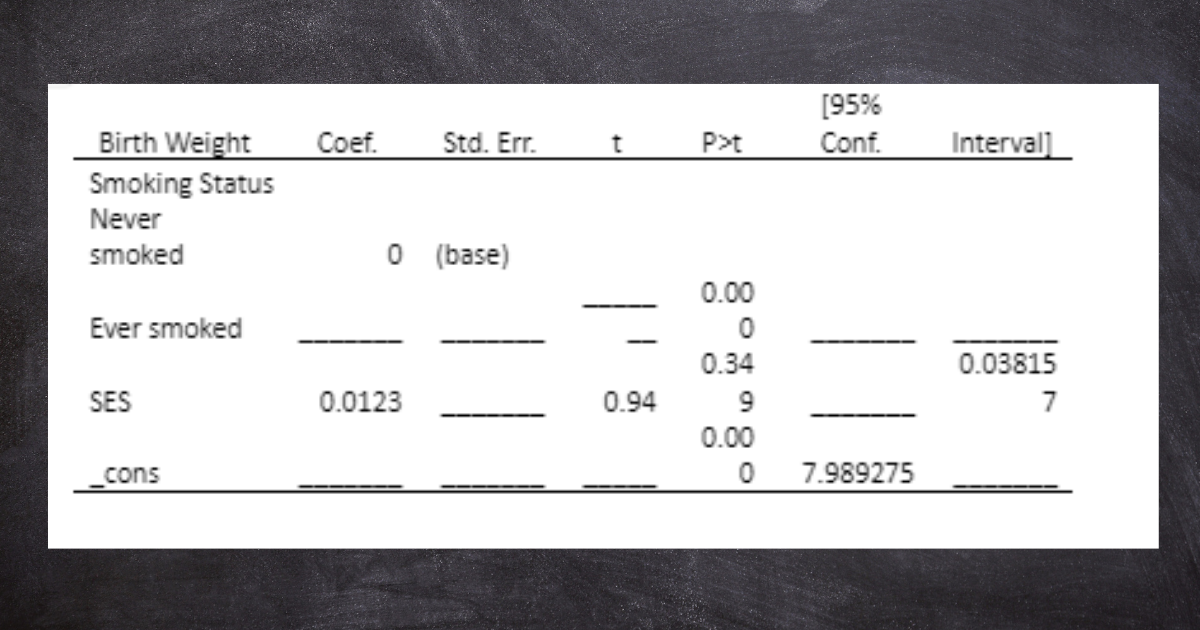
The difference between mothers who never smoked and ever smoked could not be explained by differences in socioeconomic status (SES).
Still confused if SES is a confounding factor? To get the complete solution, just WhatsApp us at +447956859420.
Next, STATA data is presented, and the students are required to perform a regression analysis of the independent variables in the data. Keep reading to know how our experts have written answers backed up with comprehensive calculations.
e. The obtained p-value is greater than the significance level, it cannot be concluded that there is a statistically significant association between mothers age (OR Mother_age = 1.106, ρ = > 0.01), routine checkup (OR Routine_checkup = 1.121, ρ = > 0.01) and low birth weight of babies.
This is only a snippet of the answer written by our expert. Call us at +61871501720 to read more.
The last part of this study incorporates an interpretation of the results of the prevalence ratio of low birth weight for women living in rural areas as compared to those residing in urban areas.
f. Prevalence = (Number of low birth weight / Number of women living in rural to urban areas) ∗ 100
= 31/162*100
= 19.14
These are only 50% of the calculations done by our experts. Don’t hesitate to WhatsApp us at +447700174710.
Study 2
The second study is based on a randomised cross-over trial which was done to evaluate the usefulness of a particular drug for sleep. The comparison was made between 30 subjects who were given the drug for one night and a placebo for another night.
The students were supposed to assess the study and propose an appropriate statistical test for the analysis of the data along with providing for its reasoning. Our experts have presented the statistical calculations in detail, some parts of which you can read below.
i. Analysis of Variance
Why? There are more than two sample groups.
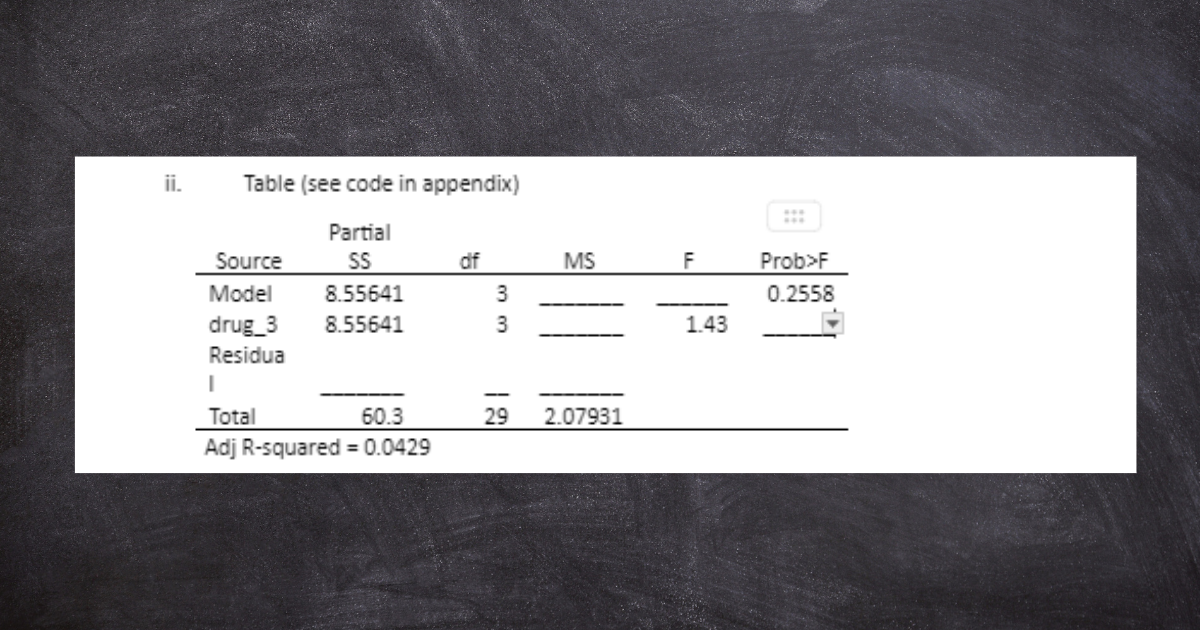
i. The p-value is greater than 5%, we do not reject the null hypothesis and conclude that the difference between the drug and placebo group means is not statistically significant.
Want help with the complete solution? Let our experts help you. Reach out today- onlineassignmentservices1@gmail.com.
Study 3
The last study assessed the relationship between the prevalence of diabetes among the adult population of central Australia with their place of residence. Our experts have analyzed the data provided for this study and presented the statistics in the form of a table. Additionally, statistical tests are proposed and conducted to test the relationship between diabetes prevalence with the place of residence.
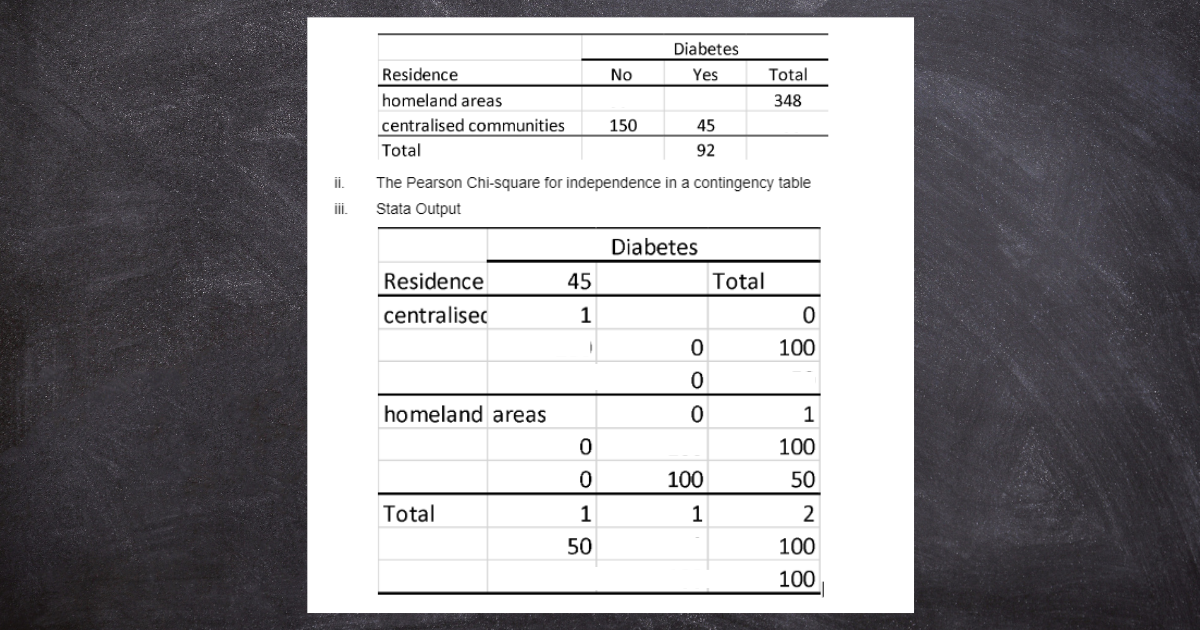
The difference in the proportion:
| Variable | Mean | Std. | [95% |
| yes_diabetes | ____ | 0.353553 | __________ |
Null hypothesis: p = 0.47 and alternative hypothesis > 0.47, or = 0.47 or <0.47
If the probability of those with diabetes is 0.47, the probability of drawing a sample of 301 observations with a proportion of people with diabetes is greater than 0.47.
If you also need assistance with your biostatics assignment, don’t hesitate to WhatsApp us at +447700174710.