MAT5212: Biostatistics Assignment Help

Question
MAT5212: This is an Edith Cowan University assignment in which the students are required to complete three questions based on statistical analysis of the data provided in the task file. The statistics analysis process demands the student to identify the most suitable statistical analysis method, conducting a descriptive statistics, while also checking for various assumptions and estimations. Based on this thorough analysis, the student is supposed to scientifically present all the analysis of the dataset.
Solution
While providing Master of Environmental science assignment help for this assessment, our experts have performed an in-depth statistical analysis on the data provided and answered all three questions given in the task file. Following this, the assignment is divided into three sections- Statistical analysis for Question 1, 2 and 3. Many students across Sydney require MAT5212 Biostatistics Assignment Help, for which experts at OAS provide best quality assistance! We have provided half of the solutions to each question for your guidance here.
Question 1
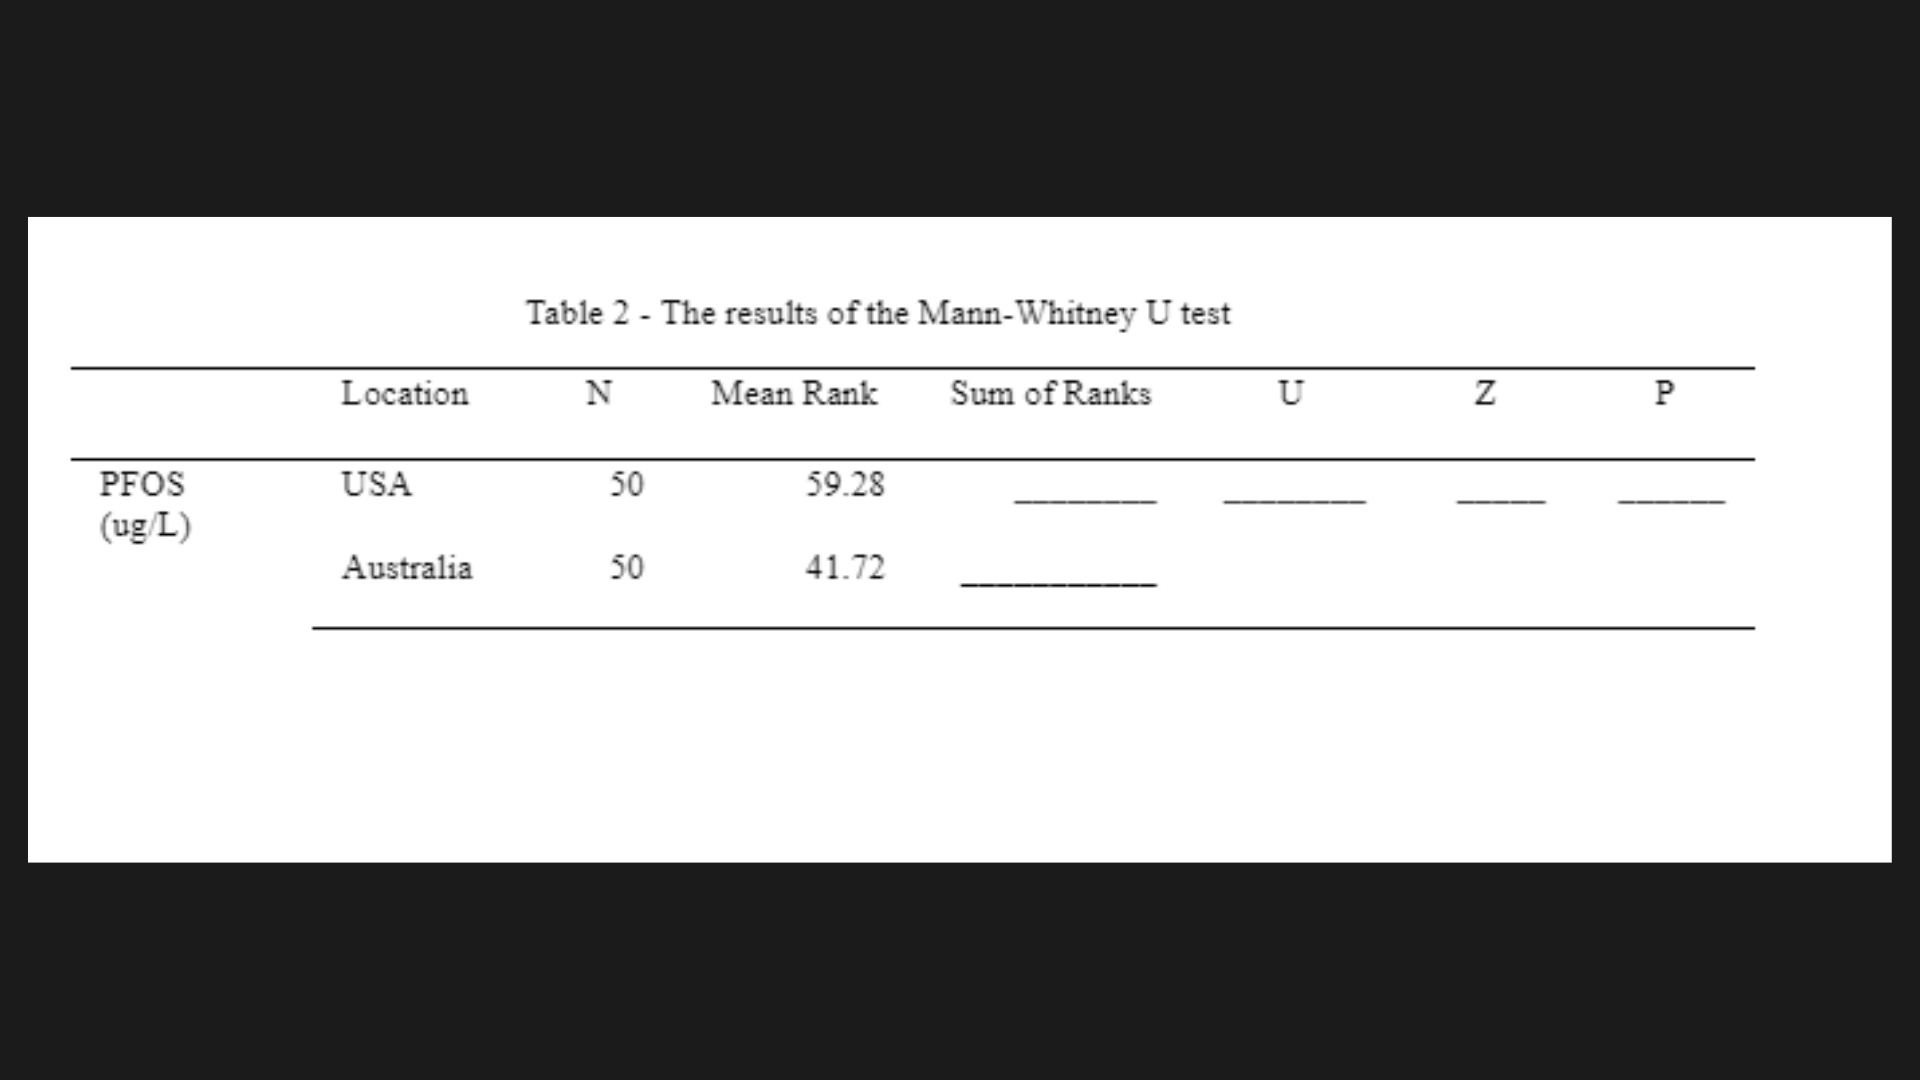
In the first question, the student is required to analyse the water quality monitoring data derived from the sample collected by AWA. Based on this analysis, an alpha of 0.01 need to be applied to the data to check whether the PFOS concentration in Australian drinking water was lower than that in the US. OAS provides the best Biostatistics assignment help in Australia as our subject matter experts demonstrate an in-depth understanding of Biostatistics to statistically analyse the data provided in the task file.
To answer Q1, we can use an independent samples t-test to compare the means of the two samples. The null hypothesis of this test states that (Ghasemi & Zahediasl, 2012):
H0: ___________________________________________________________
While the alternative hypothesis is that:
H1: ___________________________________________________________
To be able to conduct the independent samples t-test, our data needs to meet the following assumptions (Rasch et al., 2011):
- Independence of samples, which means that observations in each group should be independent of each other.
- __________________________________________________________________________________________________________________
- __________________________________________________________________________________________________________________
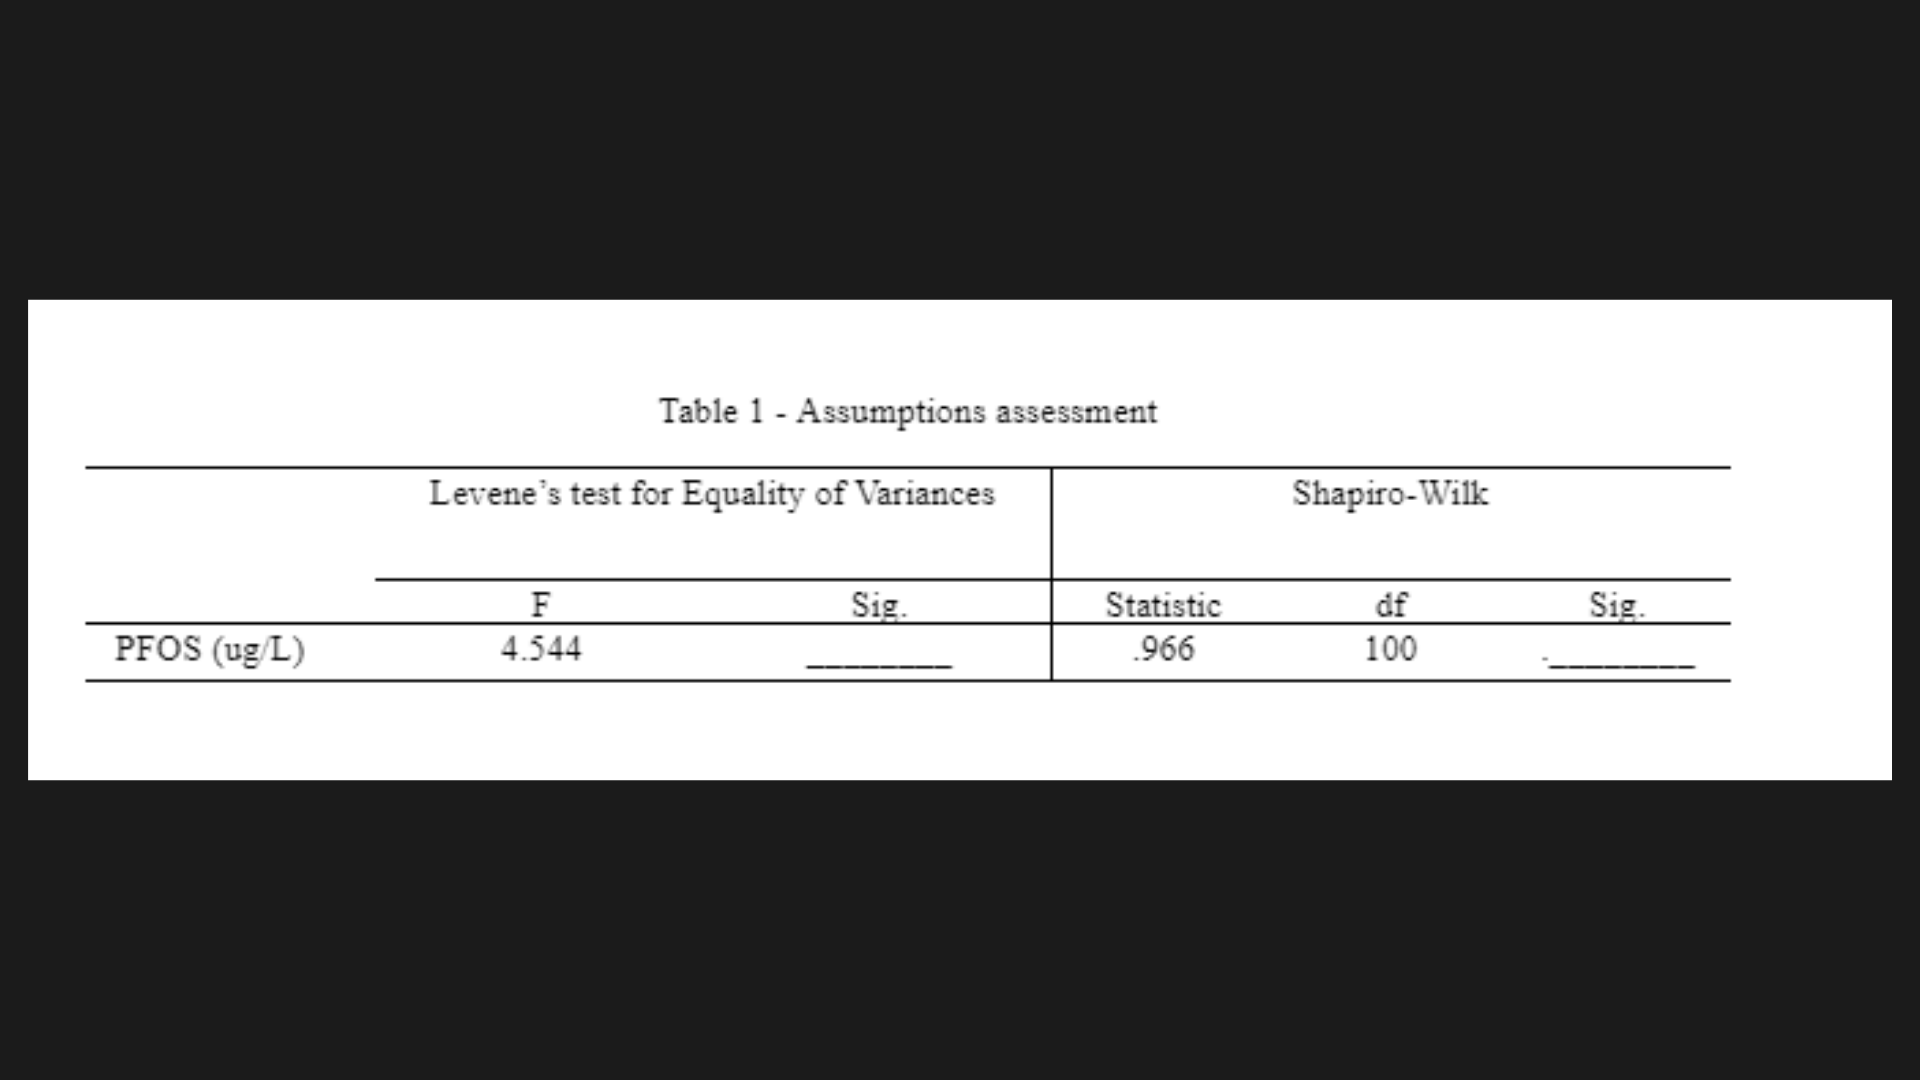
The assumption of independence of observations is met since the samples in each group are independent of each other. The other two assumptions of normality and equal variances can be tested using __________________________________________________________________________________________________________________________________________________________________________________________
The null hypothesis (H0) of the Shapiro-Wilk test is that the data are normally distributed. The alternative hypothesis (H1) is that the data are not normally distributed (Hanusz & Tarasinska, 2015).
If you were looking for Biostatistics assignment help in Australia, you are at the right place! Call us at +61 871501720.

Question 2
The data related to the symptoms of the patients before they had a VS diagnosis had been documented. The student is supposed to determine whether the WA results are statistically comparable to the British study. Extensive statistical analysis has been done by our experts to answer this question, through which MAT5212 Biostatistics Assignment Help has been provided to the students.
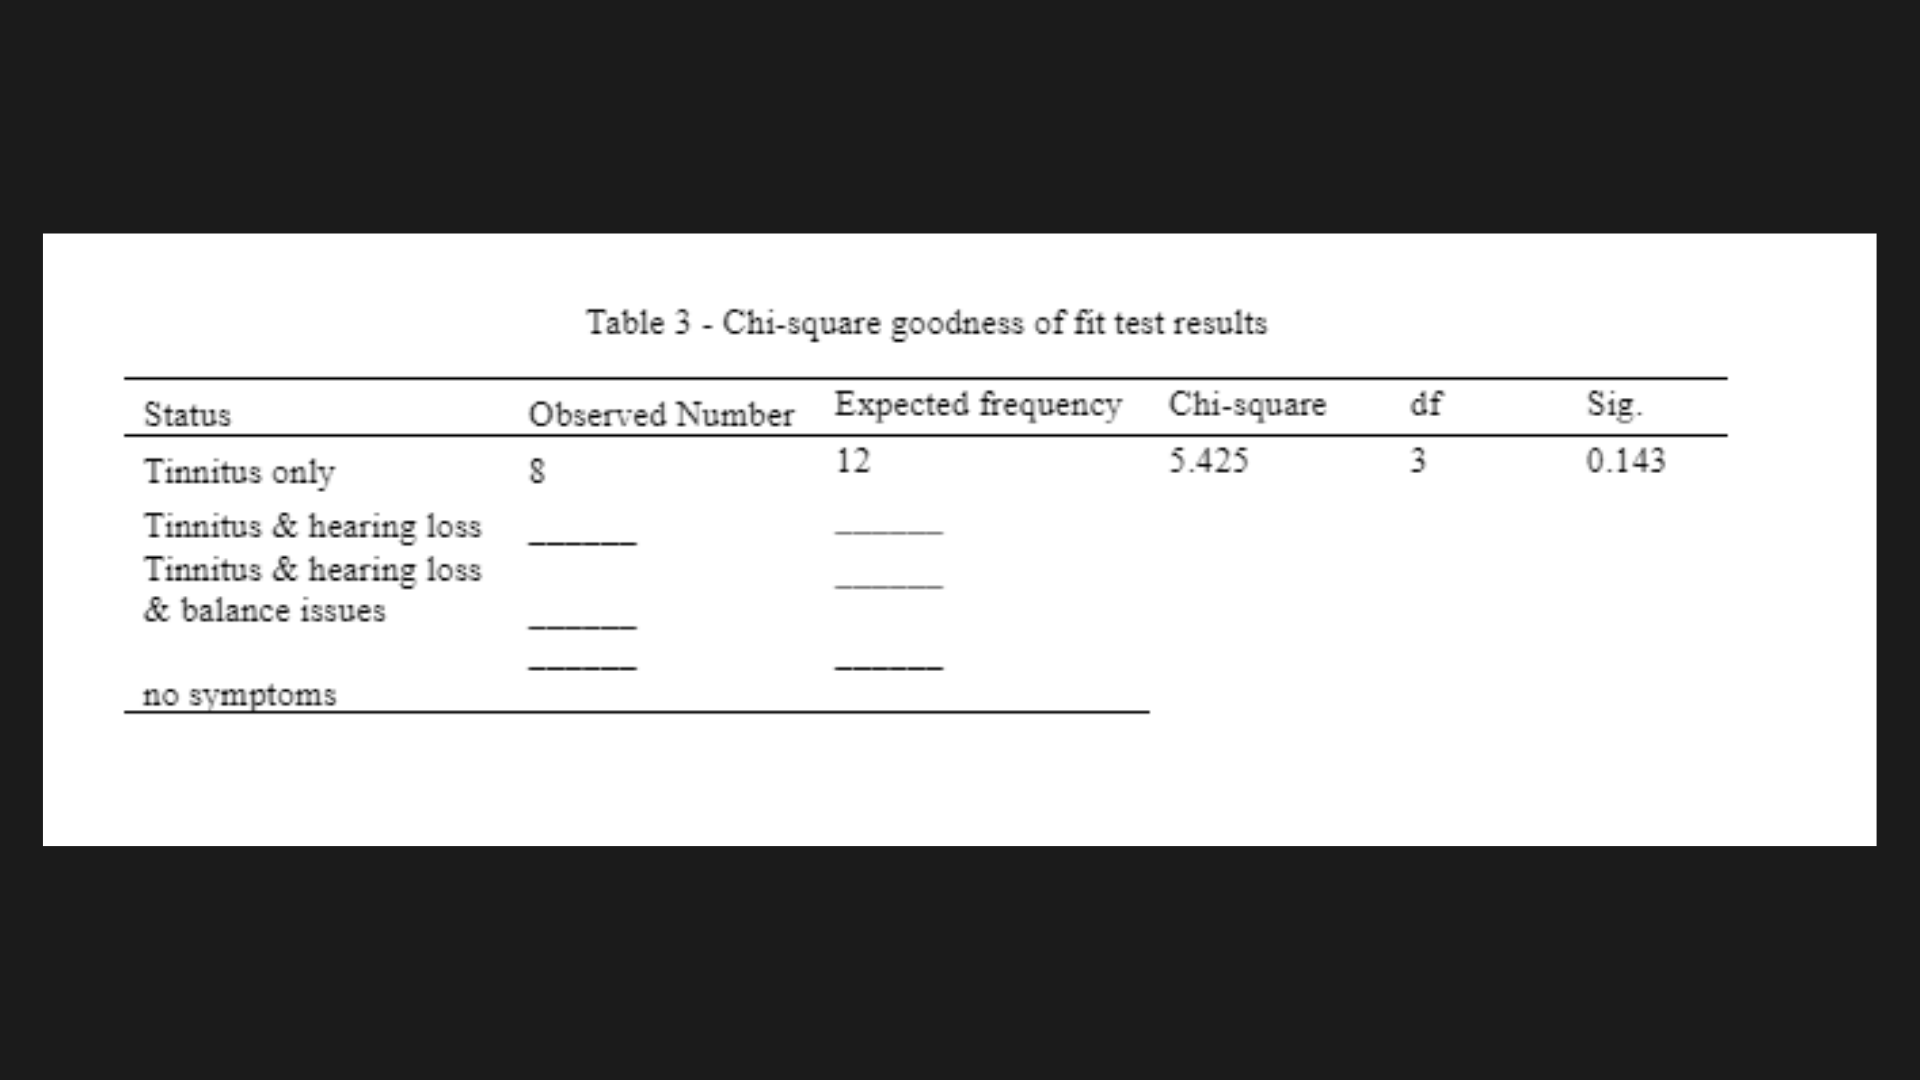
To investigate if the WA results are statistically equivalent to the findings from the British study, the obtained data can be analysed using the Chi-square test. The chi-square goodness of fit test is used to determine if a sample of categorical data matches the expected distribution or frequencies of a population (Agresti & Finlay, 2009). The null hypothesis is that the observed frequencies in WA are the same as the expected frequencies based on the British study, while the alternative hypothesis is that they are different.
Get the best Edith Cowan University assignment help in Perth at flat 20% Off! Reach out at onlineassignmentservices1@gmail.com.
Question 3
This constitutes the last question of the assignment which demanded the student to check if the characteristics listed in the data file can be used to estimate Perth’s worldwide solar radiation with alpha = 0.05. Additionally, our experts have also identified the independent variables which significantly influences this prediction. Our experts provide top-quality Edith Cowan University assignment help in Perth by presenting the results in an easy and understandable manner.
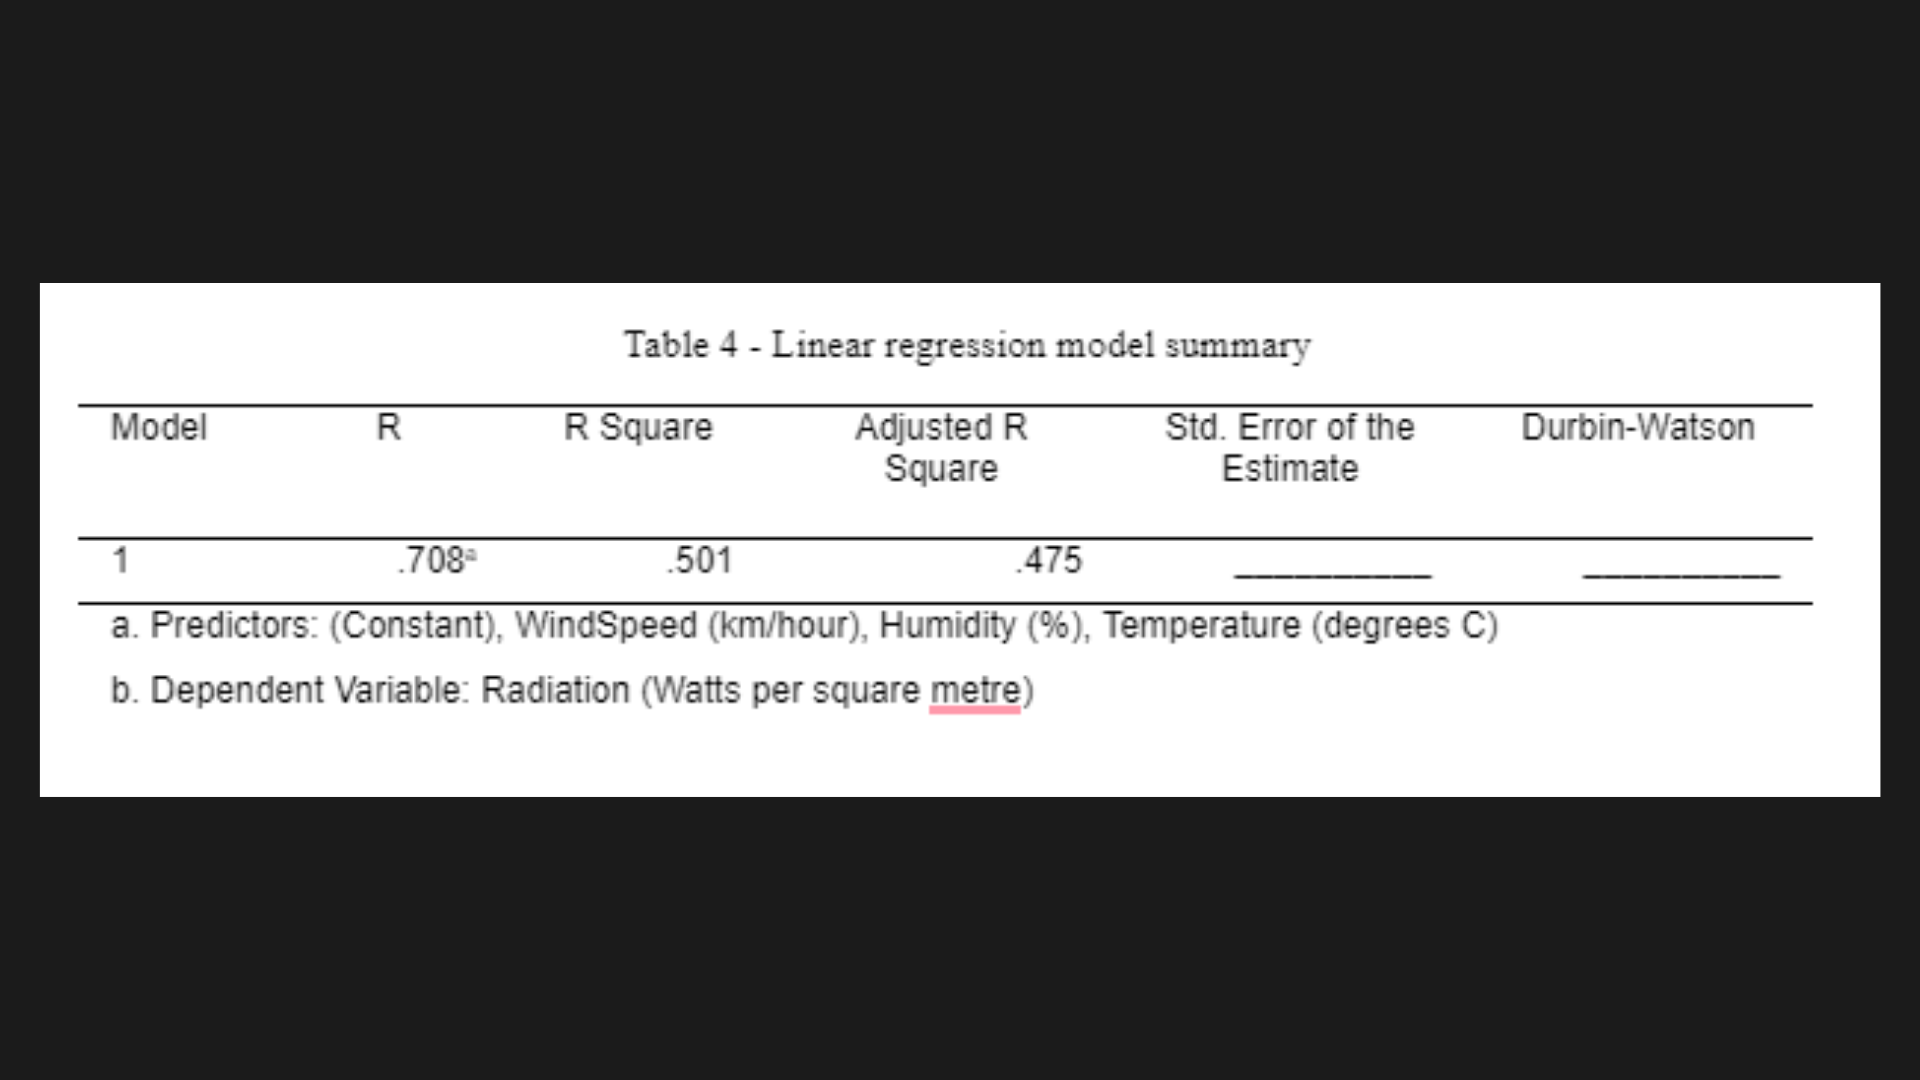
To predict global solar radiation based on temperature, humidity, and windspeed, we can use linear regression analysis. Although this analysis is widely applicable, in order for its results to be valid and reliable we need to check several assumptions of the linear regression. These assumptions are (Uyanik & Güler, 2013):
- Linearity – The relationship between the input and output variables should be linear.
- The residuals should be independent.
- __________________________________________________________________________________________________________________
- ________________________________________________________
The null and alternative hypotheses of the linear regression are:
H0: ________________________________________________________
H1: ________________________________________________________
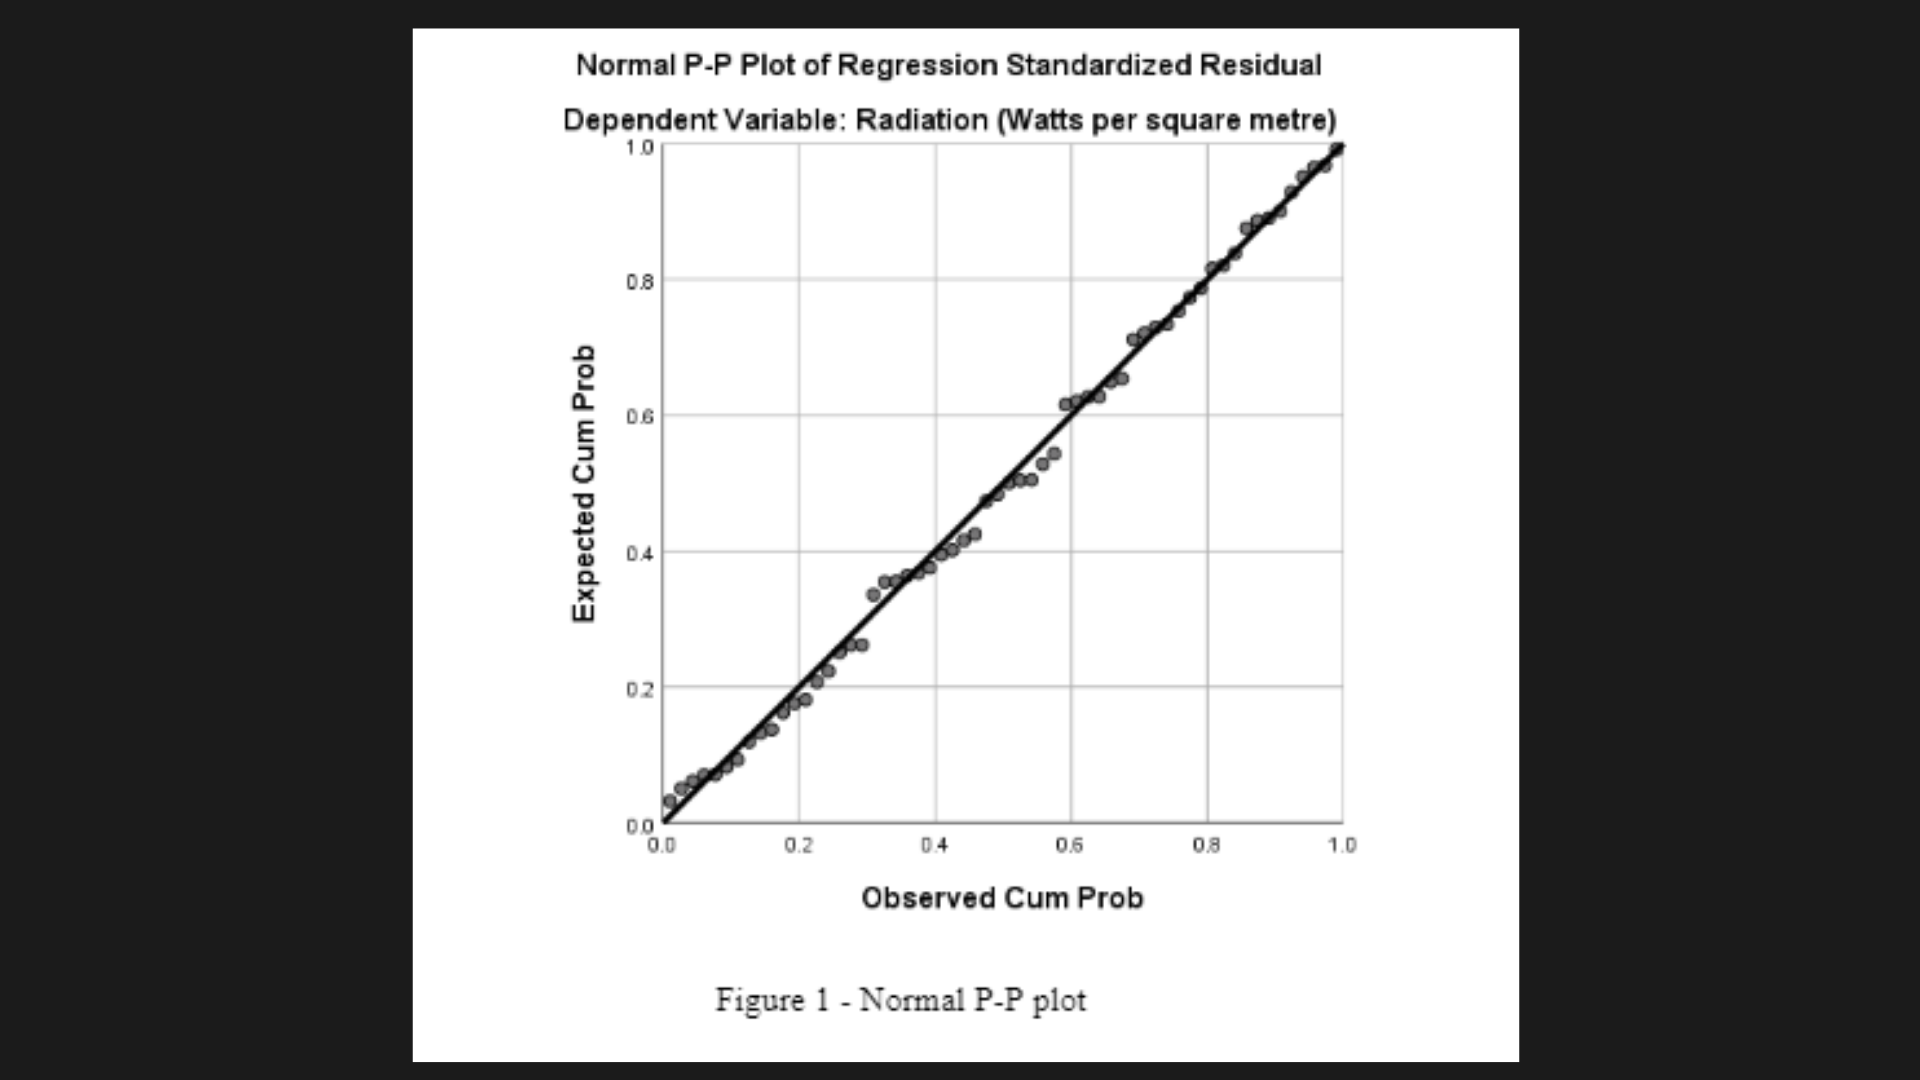
To evaluate the normality assumption of residuals, we can refer to the normal probability plot of residuals illustrated in Figure 1.
To verify the homoscedasticity assumption, we can refer to Figure 2. The scatterplot indicates that all values are within the -3 to 3 range, implying the presence of homoscedasticity and the fulfillment of this assumption.
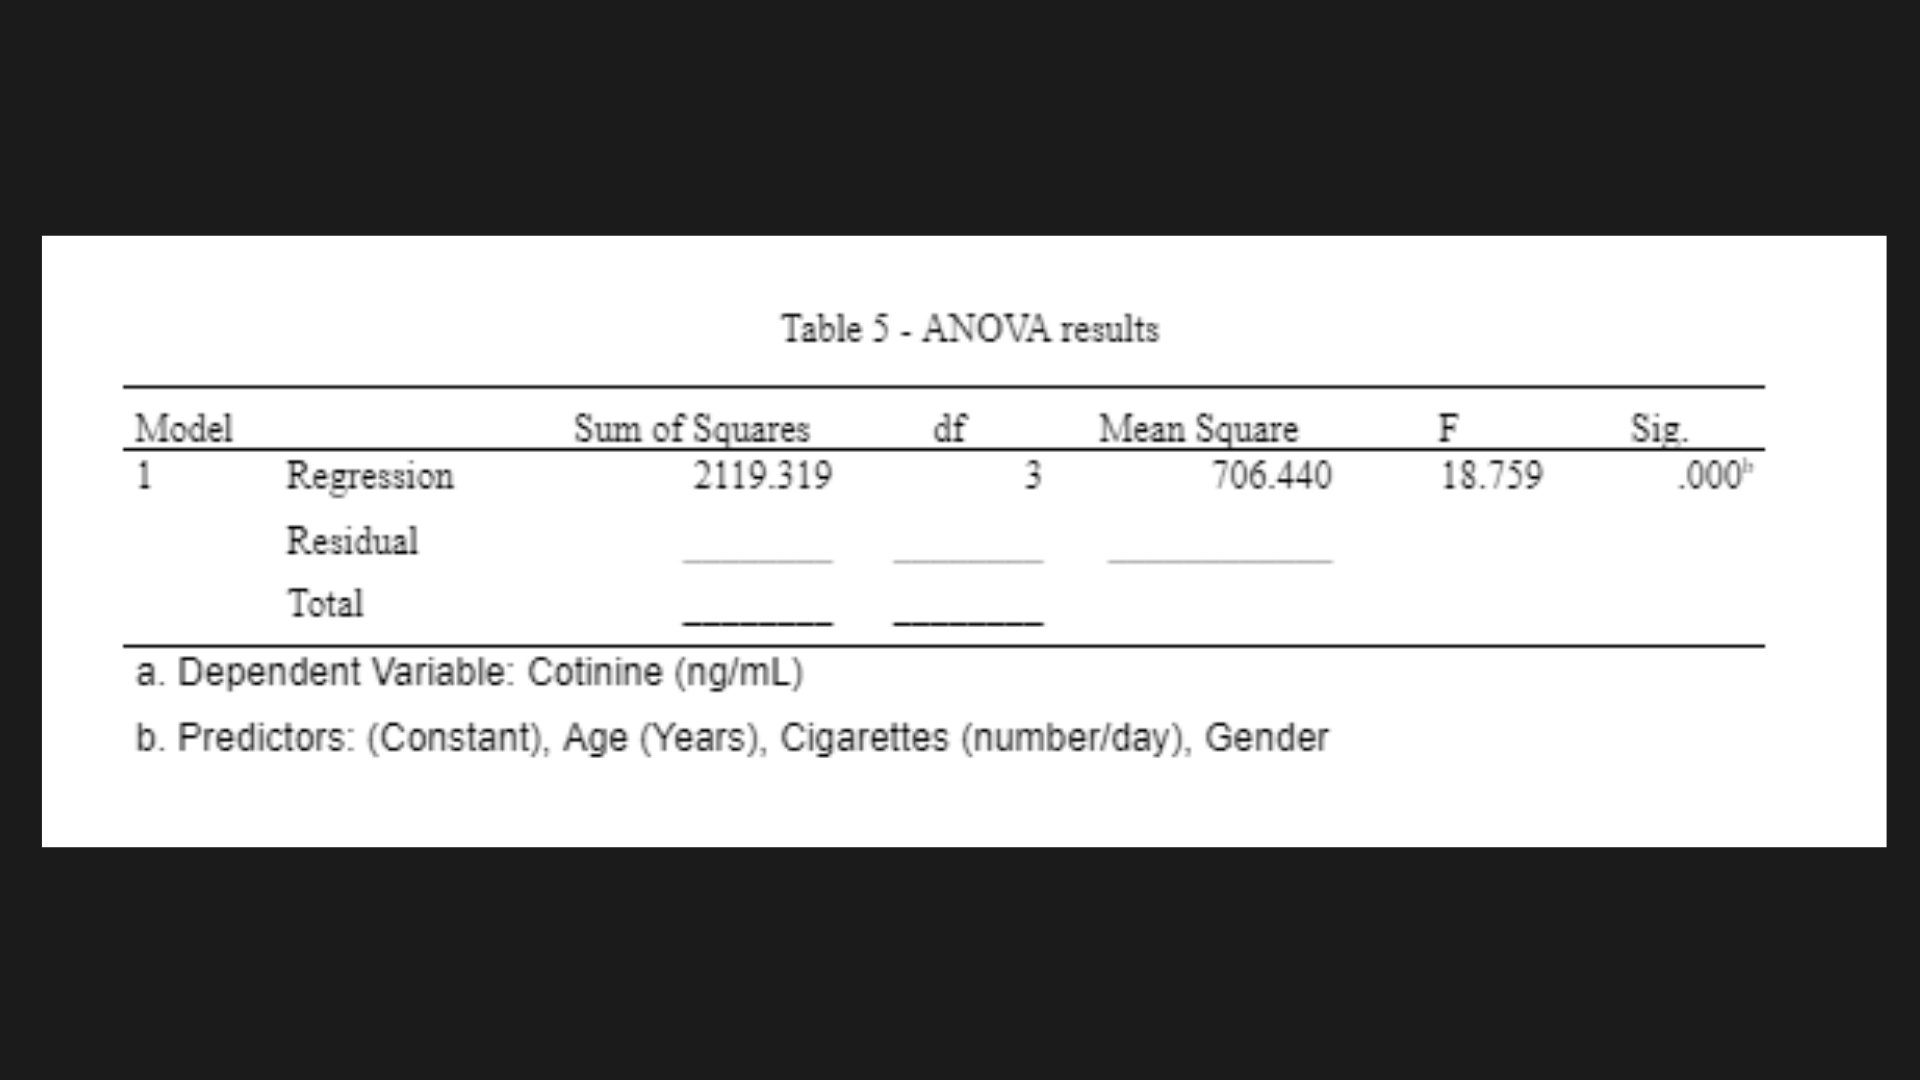
To assess the quality of fit of the regression model and its ability to accurately predict solar radiation, an analysis of variance (ANOVA) can be performed (Table 5). The ANOVA results demonstrate that the model is an appropriate predictor of solar radiation levels, with a significant test statistic, F(3,56)=18.759, p<0.001.
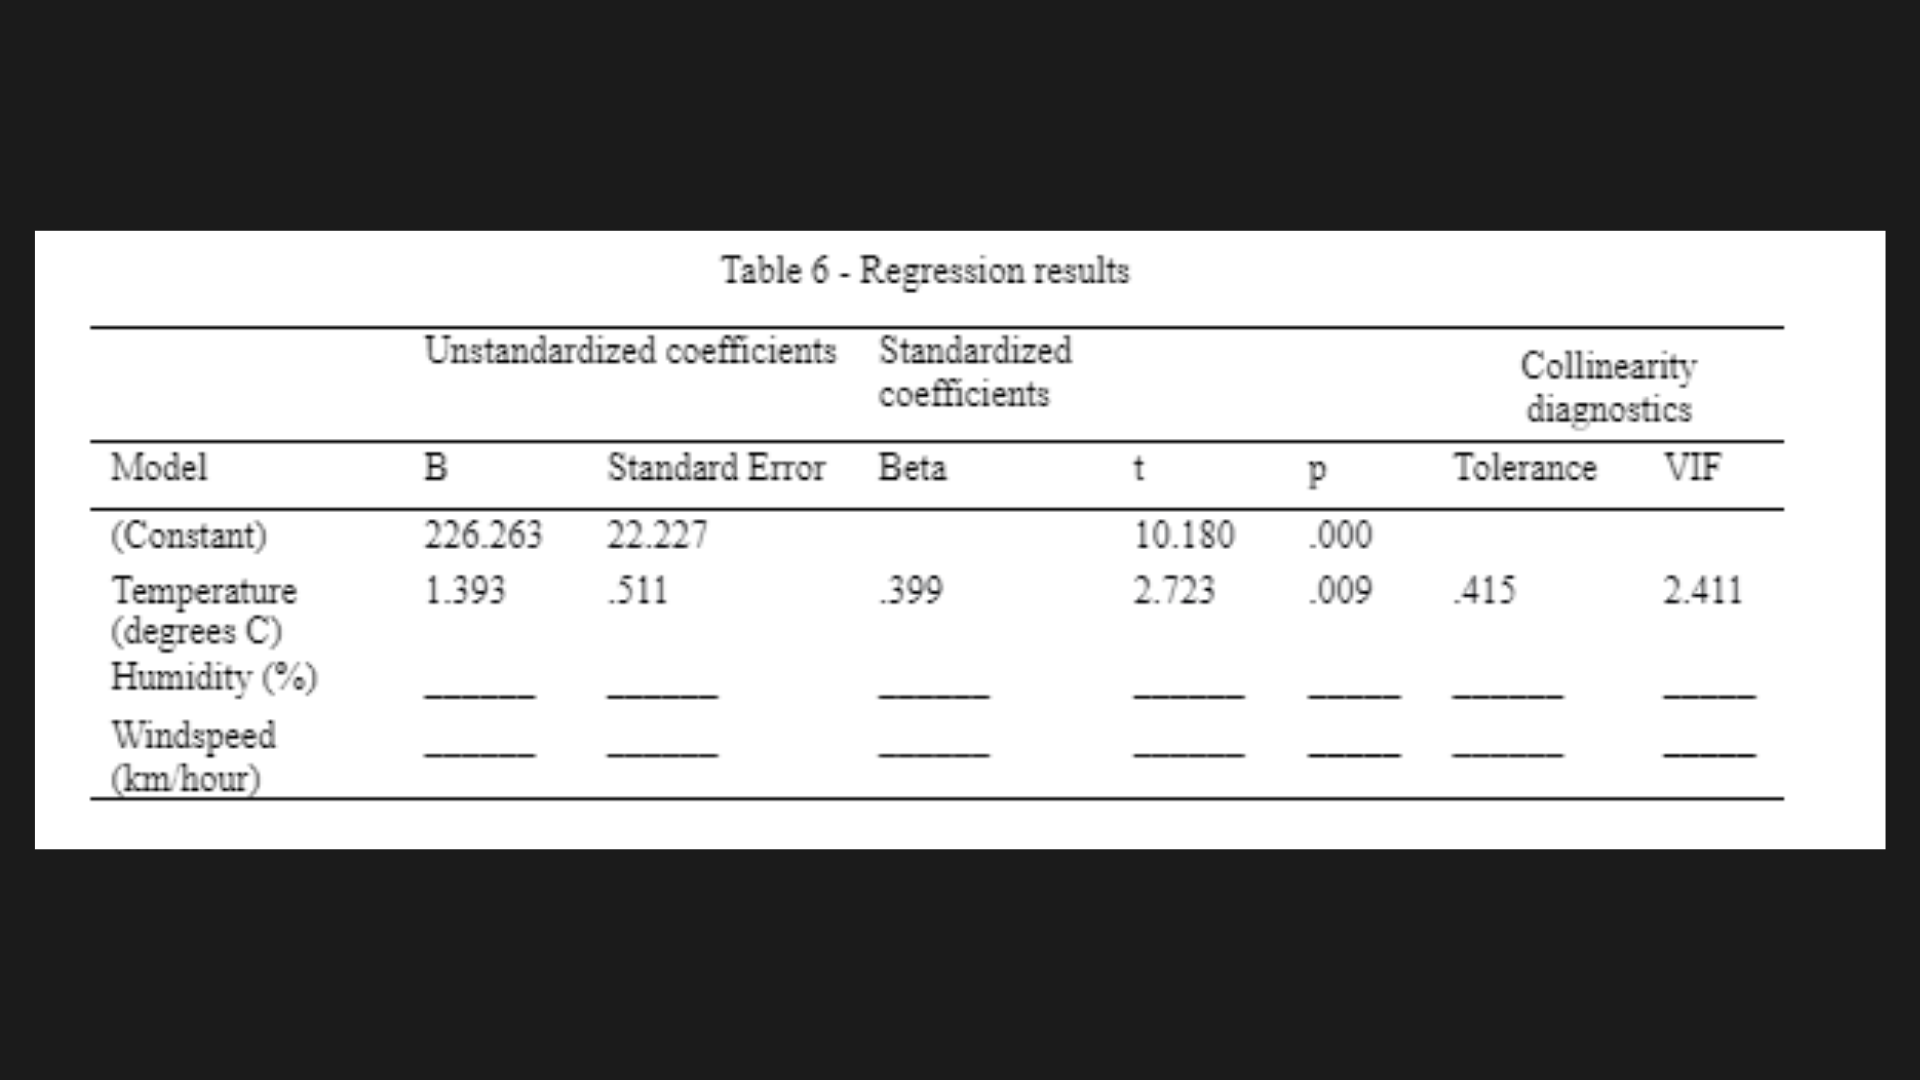
The intercept is 226.263, which means that when all predictor variables are zero, the expected radiation level is 226.263 Watts per square metre. In addition, The standardized beta coefficients show that temperature has the strongest relationship with radiation (β=0.399), followed by humidity (β=-0.355) and wind speed (β=-0.001). Based on the unstandardized coefficients, it can be inferred that there is a positive correlation between temperature and solar radiation. Specifically, a one-degree Celsius increase in temperature is associated with a 1.393 watts per square meter increase in solar radiation. Similar can be observed for humidity, but this relationship is negative, meaning that as humidity increases by one percent, solar radiation decreases by 0.555 watts per square metre.
Finally, the equation for the linear regression model can be written as:
Radiation (Watts per square metre) = 226.263 + 1.393(Temperature) – 0.555(Humidity) – 0.007(WindSpeed)
Hence, to answer the following questions:
- Which, if any, of the independent variables listed contribute significantly to this prediction?
According to Table 5, both temperature and humidity are significant predictors of solar radiation, while windspeed is not. The p-values for temperature and humidity are both less than 0.05, indicating that they have a significant effect on the dependent variable. The p-value for windspeed, on the other hand, is greater than 0.05, indicating that it does not have a significant effect on radiation.
- _____________________________________________________________________________________________________________________________________________________________________________________________________________________________________
Need Master of Environmental science assignment help? Reach out to our highly qualified experts today! Just WhatsApp us at +447700174710 today!
If you need Biostatistics assignment help for other assignments, please check out the following:
- SCI5250 EIA A2 Report Assignment Help
- MAT5212 Biostatistics Assignment 1 Help
Didn’t find what you were looking for? Read the following to get a holistic understanding of OAS expert assistance related to Environmental Science and Biostatistics assignments:
- Environmental Science Assignment Help in Australia
- Best Biostatistics Assignment Help in Australia