MAT5212: Biostatistics Assignment 1 Help

Question
MAT5212: This biostatistics assignment for Edith Cowan University requires the student to conduct a statistical analysis to answer each of the questions provided in the assessment file. Datasets have been provided for three studies about different research topics. Based on an analysis of these, the assignment demands the student to identify the most suitable hypothesis for the studies, use descriptive statistics to evaluate the assumptions proposed in the hypothesis, and conduct hypothesis testing while employing appropriate estimations for the given data.
Solution
The solution incorporates a scientific presentation of the statistical analysis conducted by our experts for each particular question. Our experts have also written supporting text in the Biostatistics Assignment 1 answers to comprehend the results of the figures and numbers clearly and concisely.
Question 1: Ozone and Bones
The first question presents a research study on the impact of ozone exposure on bone mineral density in women. The percentage increase in ozone concentration has been documented since the 1990s. 40 elderly women were taken as the participants of the study for whom data on their bone density was recorded. The student is required to determine the most appropriate hypothesis for the study, statistically analyze the data with respect to the data, and finally present a hypothesis testing based on the same.
The appropriate hypothesis test to be conducted in the given scenario would be a Repeated Measures ANOVA or RM-ANOVA. This is a suitable test for the given situation since there are more than two dependent variables whose mean needs to be compared.
The requisite hypotheses are indicated below.
H0: µ0= µ3= µ5
Ha: _____________________________________________
Level of significance = 5%
Assumptions Testing
One of the key assumptions of RM ANOVA is that _________________________________________________________________________________________________________________________________________________________________________________________________________________________________
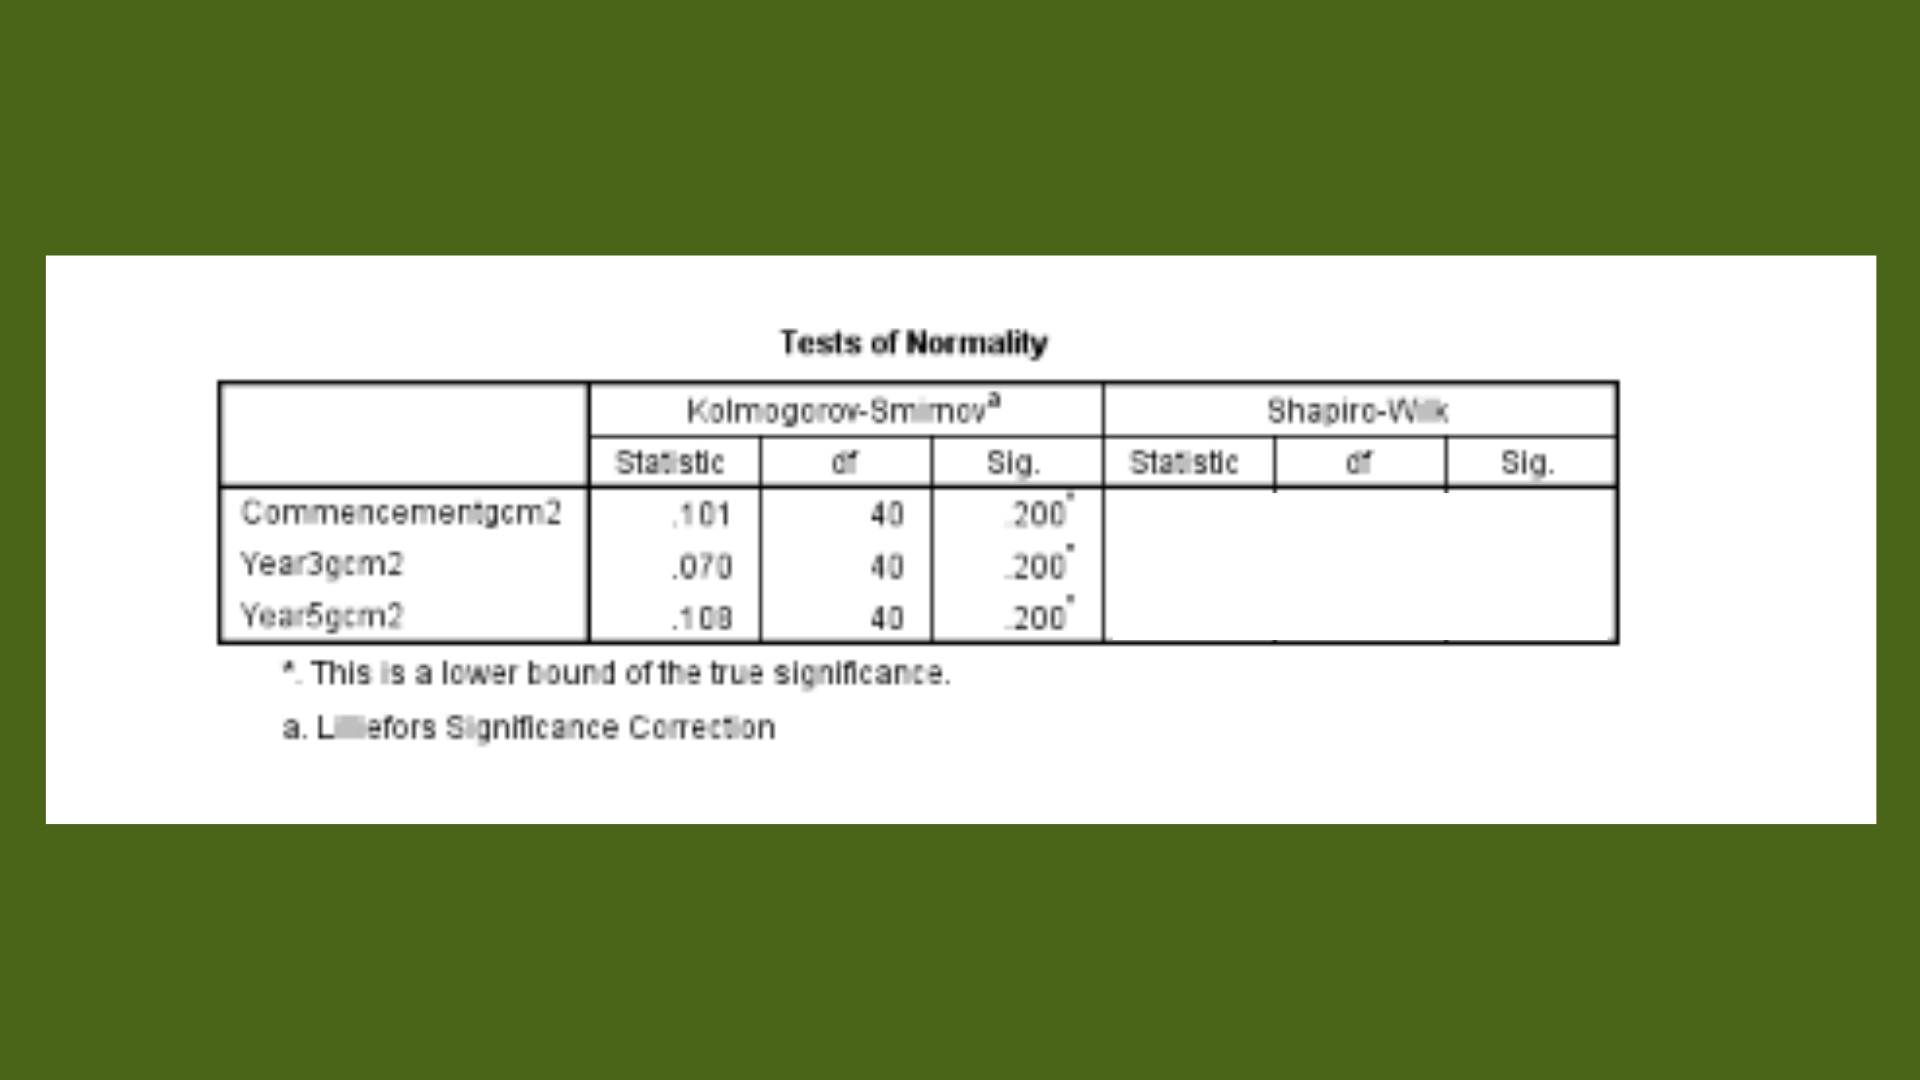
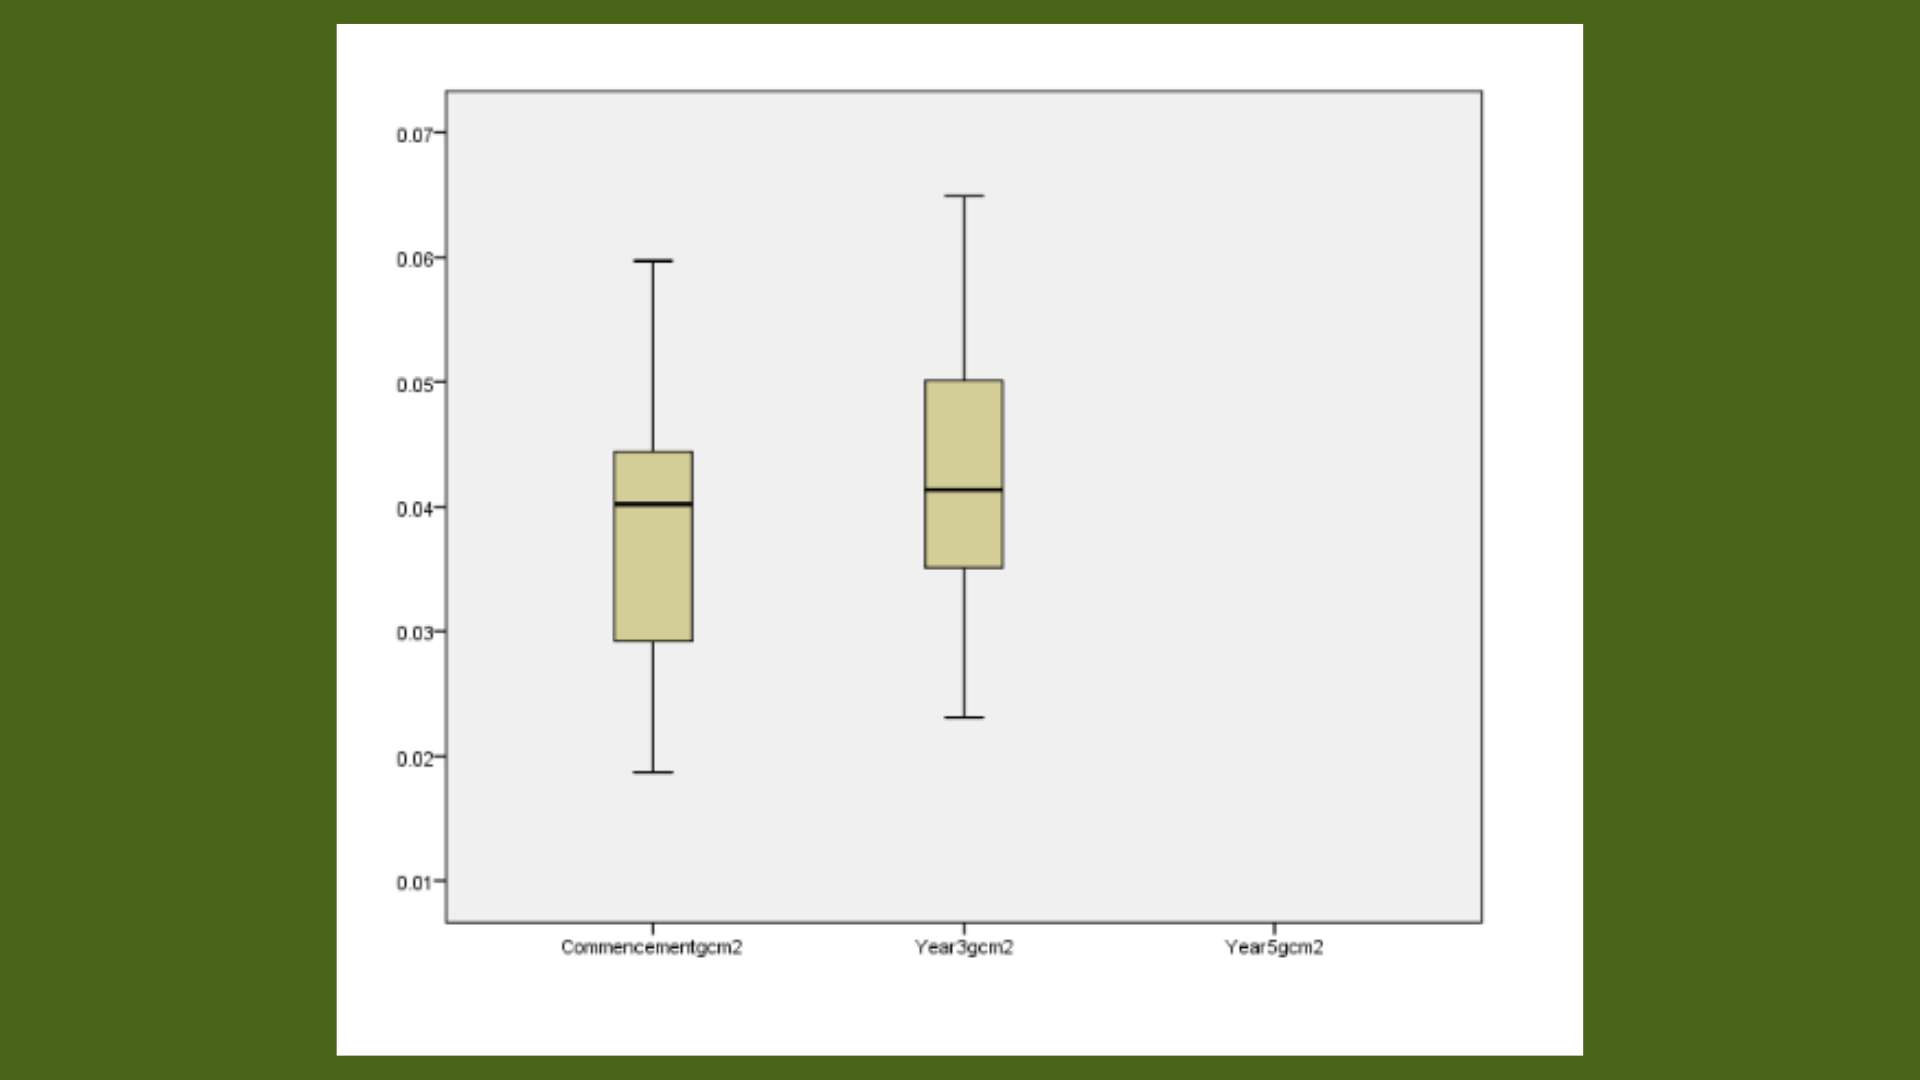
Based on the normality tests and the box plot, it is evident that the three datasets are _____________________________________________ _______________________________________________________________________________________________________________________________________
Hypothesis Testing
The RM-ANOVA output from SPSS is shown as follows.

In the first row, we observer that Fobs = 1.357 (v1=2, v2=78) and p value = 0.263. Since the p value is greater than the significance level set for this problem (i.e. 5%), hence we conclude that ____________________________________________________________________________________________________________________________________________________________________________________
Do you need Biostatistics homework help? Reach out today- onlineassignmentservices1@gmail.com.

Question 2: Turtles
In the second study, an investigation is done into the impact of the temperature of the nests where turtles lay their eggs on the time taken for the eggs to hatch. 90 turtle eggs were assessed for the purpose of this study. Assuming 5% level of significance and statistically analysing the data provided in the question, our experts have written up-to-mark biostatistics assignment 1 answers.
The appropriate hypothesis test to be conducted in the given scenario is one-way ANOVA since the means of the three independent datasets needs to be compared simultaneously.
The relevant hypotheses are as stated below.
H0: µconstant24 = µVariable24 = µconstant31
Ha: _____________________________________________
Assumptions Testing
One of the key assumptions of One way ANOVA is that all the variables should be normally distributed.
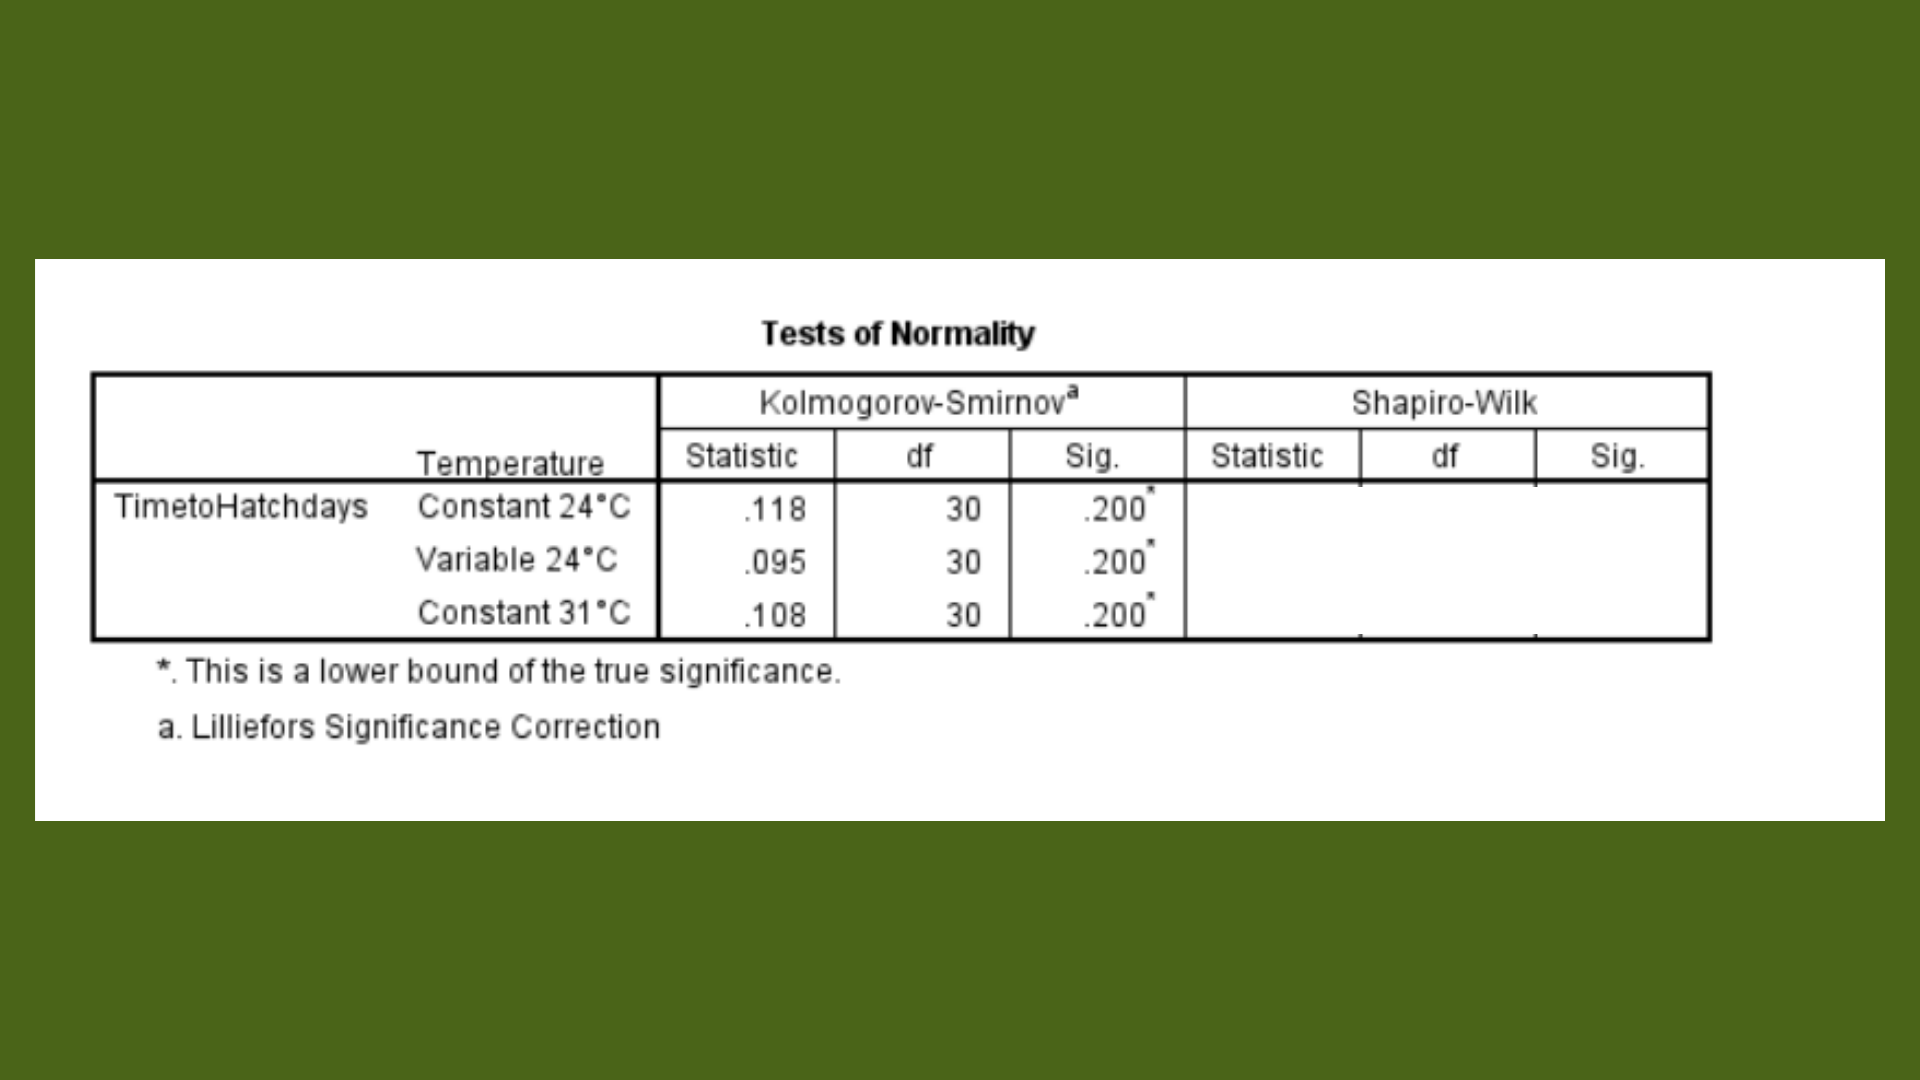
Since the sample size is less than 50 for each, hence, Shapiro-Wilk test for normality would be suitable. As the p value for each of the variables exceeds 0.05, hence it can be concluded that each of the given variables is normally distributed.
Another key assumption of one way ANOVA is __________________________________________________________________________________________
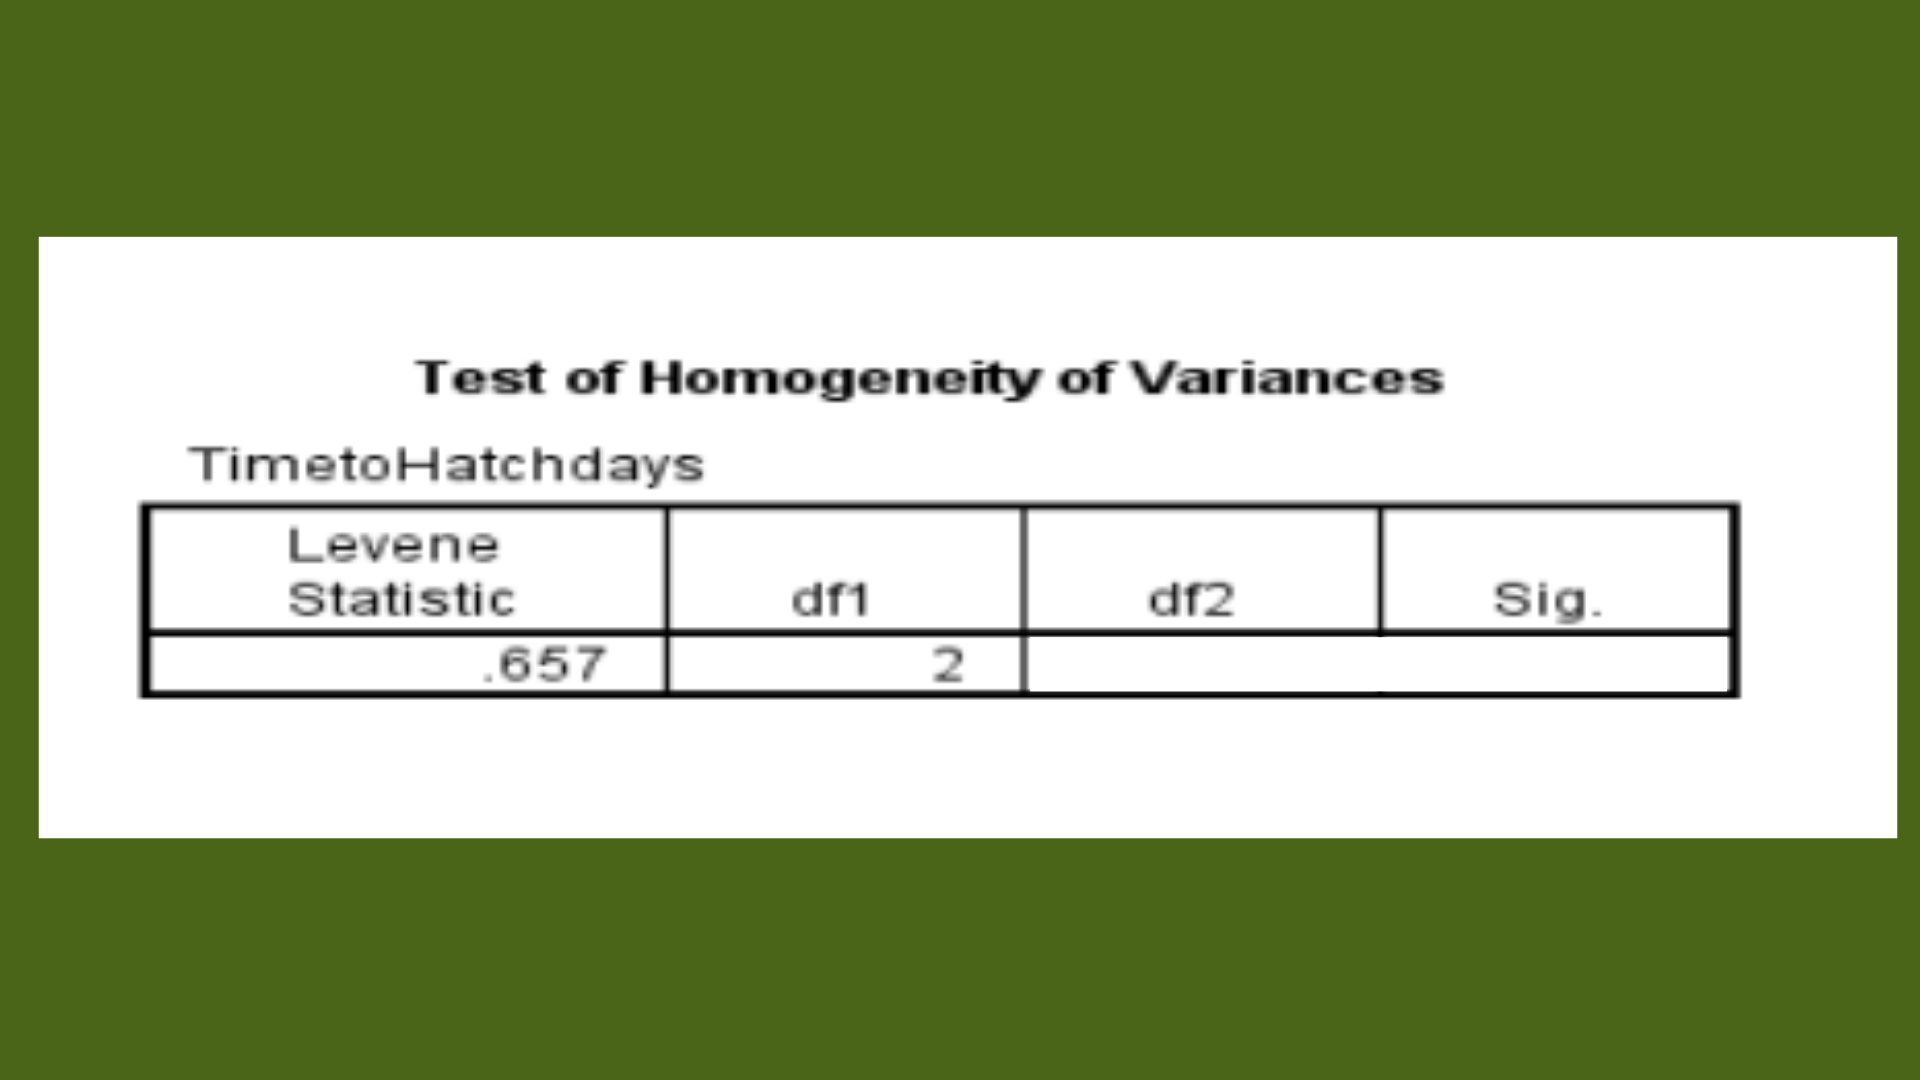
Since the p value (0.521) is greater than 0.05, hence it can be concluded that the assumption regarding homogeneity of variance across different datasets has _____________________________________________ _____________________________________________
Hypothesis Testing
The relevant output for ANOVA from SPSS is illustrated as follows.

Fobs = 154.832 for degree of freedom v1 = 2 and v2 = ________. The corresponding p value is 0.000 which is lower than the level of significance and hence the null hypothesis would ____________________________________________
Hence, it can be concluded that __________________________________________________________________________________________
In order to determine which pair of groups has significant difference in the average hatching time, multiple comparisons has been performed.
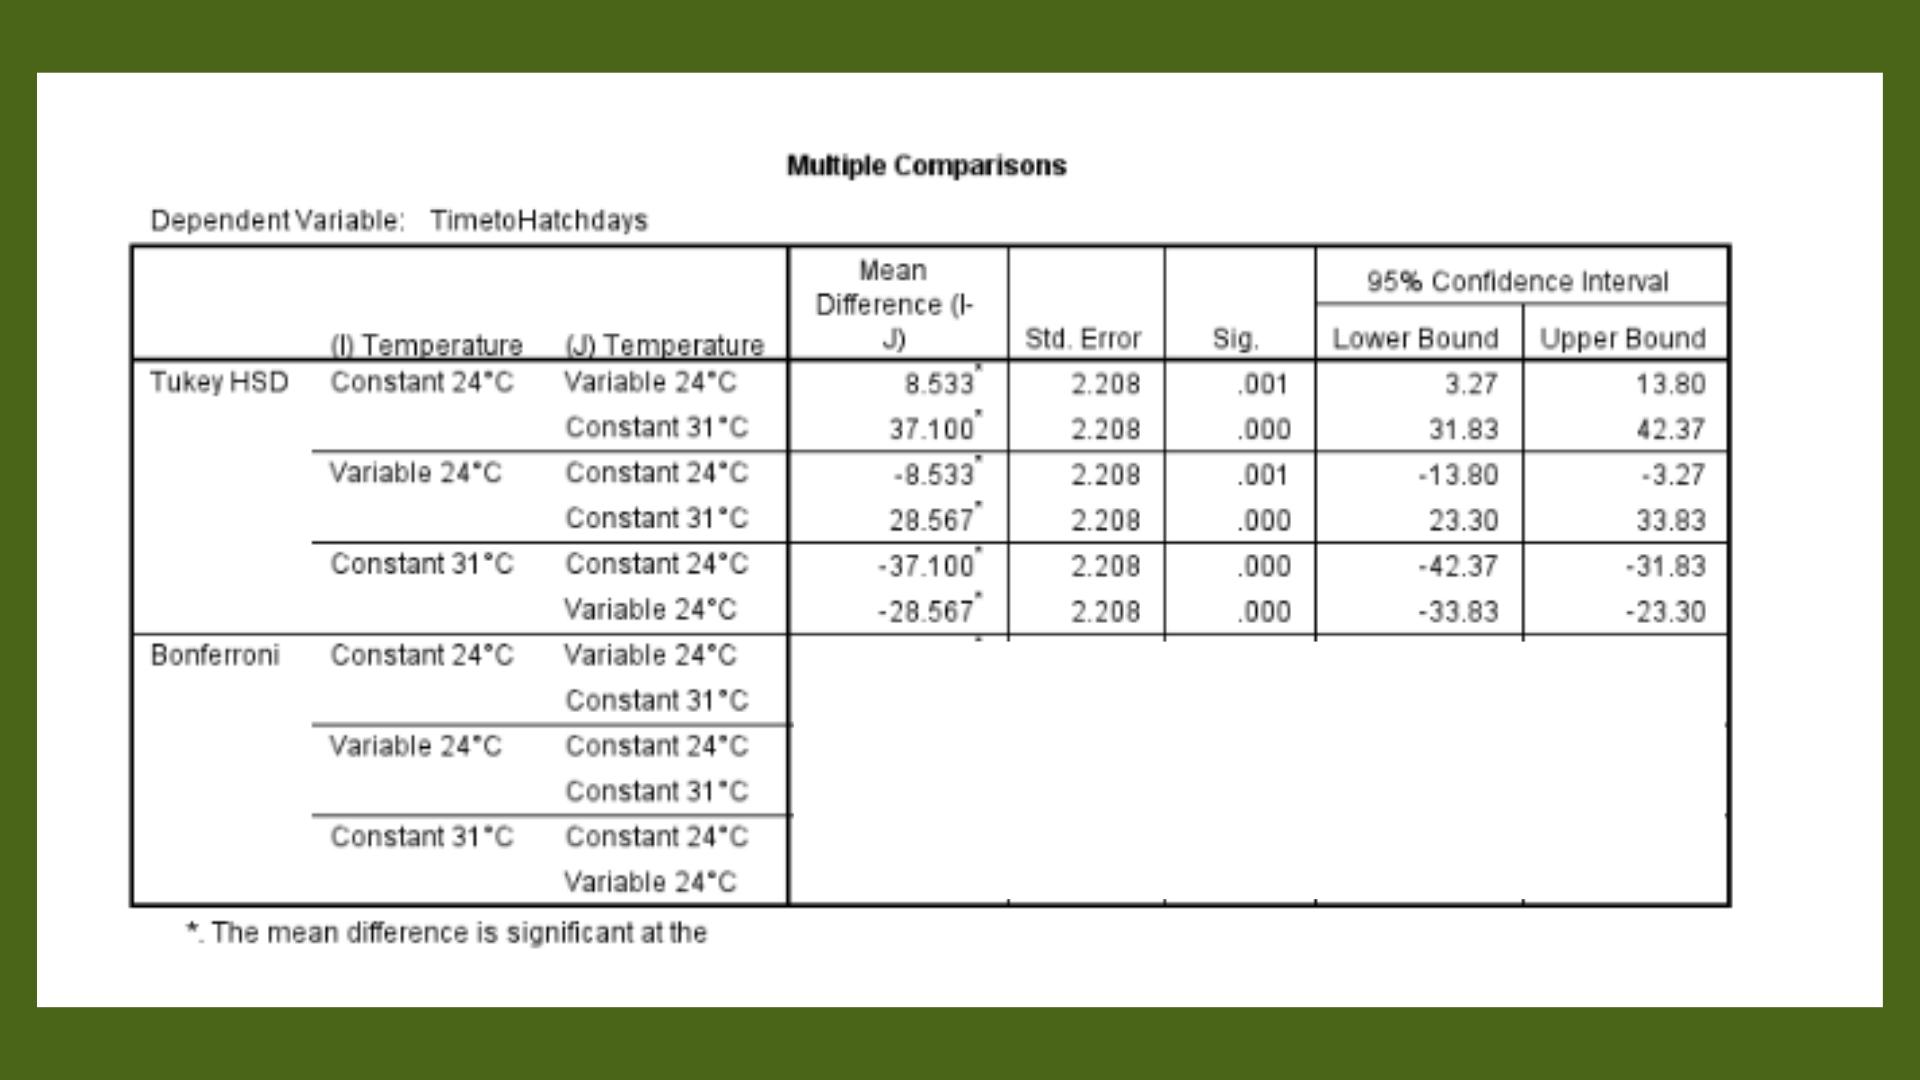
Using Bonferroni method of post hoc analysis, we can infer that there is significant difference between the mean times to hatch for eggs across all possible comparisons. ____________________________________________________________________________________________________________________________________________________________________________________
Thus, it can be concluded that _____________________________________________ _______________________________________________________________________________________________________________________________________
Curious about complete Biostatistics Assignment 1 answers written by our experts? Call us at +61871501720 to read more.
Question 3: Biochar
In this last question, the student is required to engage with a research study investigating whether biochar, a charcoal-like product is suitable for storing nitrogen or not. Our experts have completed the statistical analysis with utmost precision and have supported all the calculations with justifying written text.
The appropriate hypothesis test to be conducted in the given scenario is a two sample paired t test. This is the suitable test since the nitrogen content of the same ten blocks has been compared before and after the application of charcoal.
The relevant hypotheses are as follows.
H0: µd ≤ 0
Ha: _____________________________________________
Level of significance = 1%
The relevant output for ___________________________________________ _______________________________________________________________________________________________________________________________________
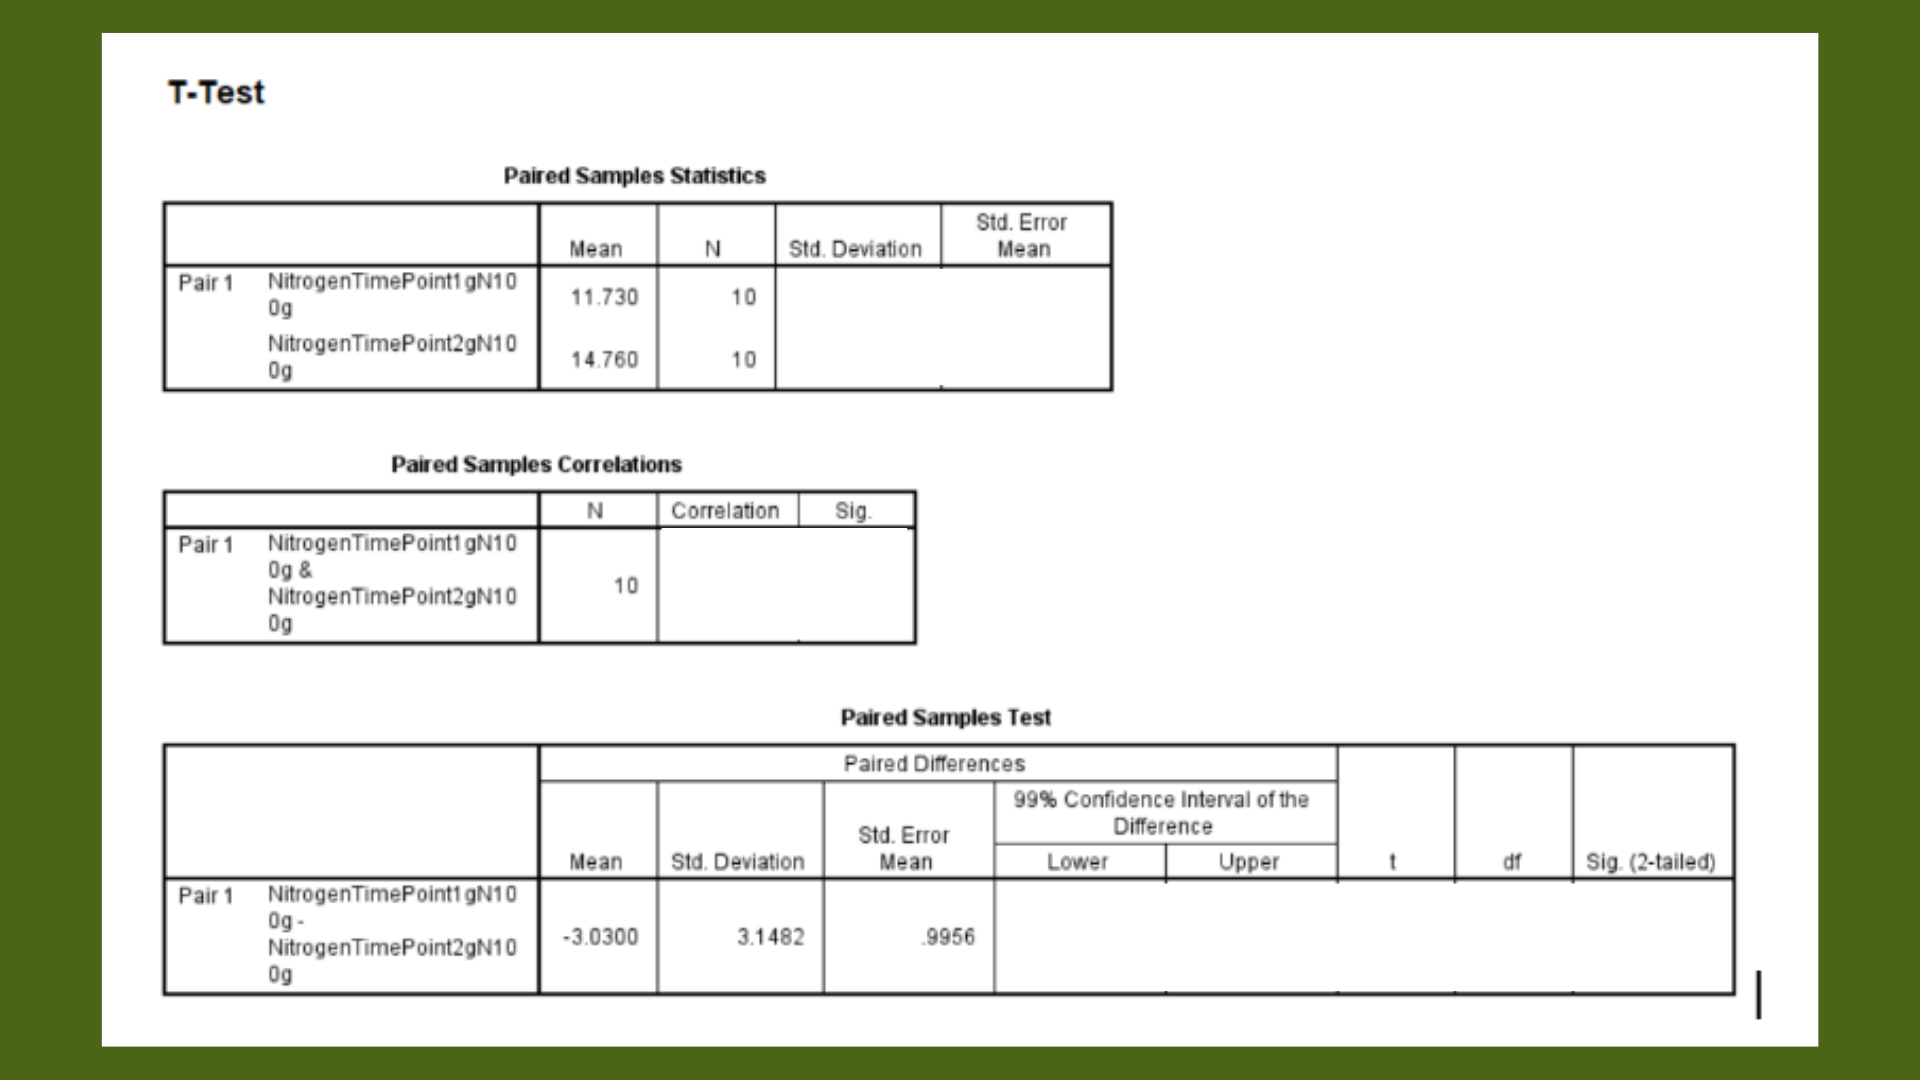
99% confidence interval of the difference is (-6.2654, 0.2054). Since the confidence interval of the difference contains zero, hence null hypothesis ____________________________________________________________________________________________________________________________
Also, t(9) = ______________________
Resulting p value is 0.014 which is greater than the 1% significance level we have considered for this scenario. _________________________________________________________________________________________________________________________________________________________________________________________________________________________________
If you also need Biostatistics Assignment 1 Help, WhatsApp us at +447956859420.